一、统计数据频率

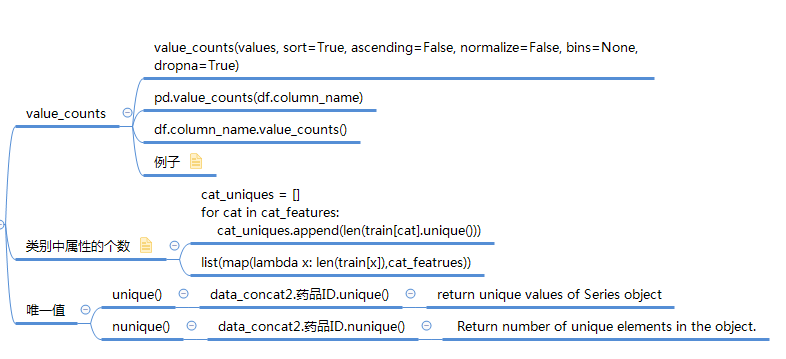
1. values_counts
pd.value_counts(df.column_name)
df.column_name.value_counts()

Series.value_counts(normalize=False, sort=True, ascending=False, bins=None, dropna=True)[source]
Return a Series containing counts of unique values.
参数详解
normalize : boolean, default False
If True then the object returned will contain the relative frequencies of the unique values.

sort : boolean, default True
Sort by values.

ascending : boolean, default False
Sort in ascending order.

bins : integer, optional
Rather than count values, group them into half-open bins, a convenience for pd.cut, only works with numeric data.

dropna : boolean, default True
Don’t include counts of NaN.
参数示例讲解
index = pd.Index([3, 1, 2, 3, 4, np.nan])
index.value_counts()
Out[144]:
3.0    2
4.0    1
2.0    1
1.0    1
dtype: int64
index.value_counts(normalize=True)
Out[145]:
3.0    0.4
4.0    0.2
2.0    0.2
1.0    0.2
dtype: float64
index.value_counts(bins=3)
Out[146]:
(2.0, 3.0]      2
(0.996, 2.0]    2
(3.0, 4.0]      1
dtype: int64
index.value_counts(dropna=False)
Out[148]:
 3.0    2
NaN     1
 4.0    1
 2.0    1
 1.0    1
dtype: int64

In [21]:  data=pd.DataFrame(pd.Series([1,2,3,4,5,6,11,1,1,1,1,2,2,2,2,3]).values.reshape(4,4),columns=['a','b','c','d'])

In [22]: data
Out[22]:
   a  b   c  d
0  1  2   3  4
1  5  6  11  1
2  1  1   1  2
3  2  2   2  3

In [23]: pd.value_counts(data.a)
Out[23]:
1    2
2    1
5    1
Name: a, dtype: int64

In [26]: pd.value_counts(data.a).sort_index()
Out[26]:
1    2
2    1
5    1
Name: a, dtype: int64

In [27]: pd.value_counts(data.a).sort_index().index
Out[27]: Int64Index([1, 2, 5], dtype='int64')

In [28]: pd.value_counts(data.a).sort_index().values
Out[28]: array([2, 1, 1], dtype=int64)
2.类别中属性的个数
# 方式一
cat_uniques = []
for cat in cat_features:
    cat_uniques.append(len(train[cat].unique()))
uniq_values_in_categories = pd.DataFrame.from_items([('cat_name', cat_features), ('unique_values', cat_uniques)])

# 方式二
list(map(lambda x: len(train[x]),cat_featrues))
3.唯一值

二、数据去重

    def drop_duplicates(self, subset=None, keep='first', inplace=False):
        """
        Return DataFrame with duplicate rows removed, optionally only
        considering certain columns

        Parameters
        ----------
        subset : column label or sequence of labels, optional
            Only consider certain columns for identifying duplicates, by
            default use all of the columns
        keep : {'first', 'last', False}, default 'first'
            - ``first`` : Drop duplicates except for the first occurrence.
            - ``last`` : Drop duplicates except for the last occurrence.
            - False : Drop all duplicates.
        inplace : boolean, default False
            Whether to drop duplicates in place or to return a copy

        Returns
        -------
        deduplicated : DataFrame
        """

- duplicated()方法
- 查看列是否重复
dataframe.colname.duplicated()
- 查看整行是否重复
dataframe.duplicated()
- 查看subset是否重复
dataframe.duplicated(subset = [])
- drop_duplicats()方法
用于丢弃重复项
dataframe.drop_duplicats()
- 参数keep
keep可以为first和last,表示是选择最前一项还是最后一项保留。
dataframe.duplicated(keep = "first")
dataframe.duplicated(keep = "last")
也可以设置布尔类型,当设为False时候,重复项将都被显示。
dataframe.duplicated(keep = "False")
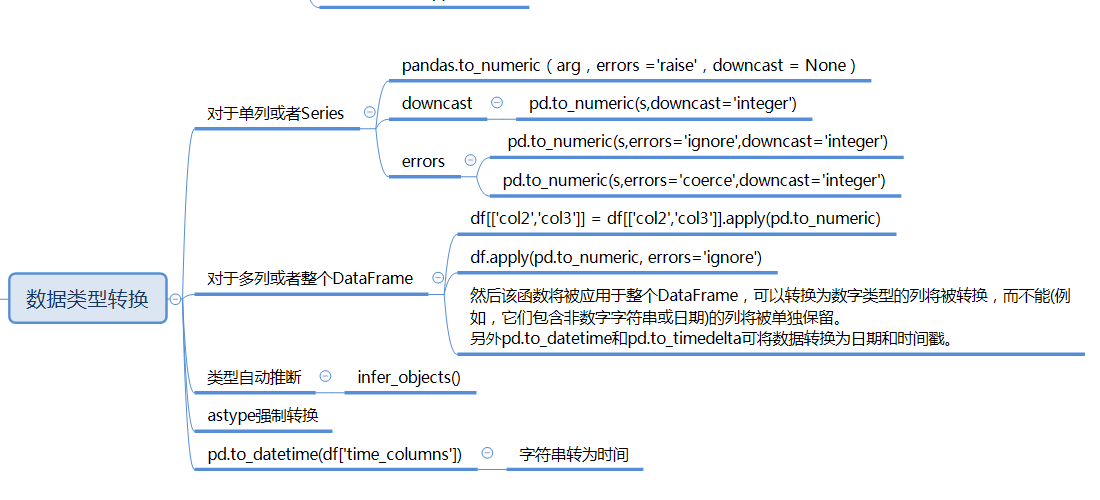
三、数据类型转换

四、聚合方法


import pandas as pd
from matplotlib import pyplot as plt
import numpy as np
pd.set_option('display.max_columns',None)
df = pd.read_csv('911.csv')
print(df.head(1))
         lat        lng                                               desc
0  40.297876 -75.581294  REINDEER CT & DEAD END;  NEW HANOVER; Station ...
       zip                   title            timeStamp          twp
0  19525.0  EMS: BACK PAINS/INJURY  2015-12-10 17:10:52  NEW HANOVER
                     addr  e
0  REINDEER CT & DEAD END  1
df.info()
<class 'pandas.core.frame.DataFrame'>
RangeIndex: 249737 entries, 0 to 249736
Data columns (total 9 columns):
lat          249737 non-null float64
lng          249737 non-null float64
desc         249737 non-null object
zip          219391 non-null float64
title        249737 non-null object
timeStamp    249737 non-null object
twp          249644 non-null object
addr         249737 non-null object
e            249737 non-null int64
dtypes: float64(3), int64(1), object(5)
memory usage: 17.1+ MB
#获取分类
temp_list = df.title.str.split(':').tolist()
cate_list = list(set([i[0] for i in temp_list]))
cate_list
Out[152]: ['Fire', 'Traffic', 'EMS']
#构造全为0的数组
zeros_df = pd.DataFrame(np.zeros((df.shape[0],len(cate_list))),columns=cate_list)
#赋值
for cate in cate_list:
    zeros_df[cate][df.title.str.contains(cate)] = 1
print(zeros_df)
        Fire  Traffic  EMS
0        0.0      0.0  1.0
1        0.0      0.0  1.0
2        1.0      0.0  0.0
3        0.0      0.0  1.0
4        0.0      0.0  1.0
5        0.0      0.0  1.0
6        0.0      0.0  1.0
7        0.0      0.0  1.0
8        0.0      0.0  1.0
9        0.0      1.0  0.0
10       0.0      1.0  0.0
11       0.0      1.0  0.0
12       0.0      1.0  0.0
13       0.0      1.0  0.0
14       0.0      1.0  0.0
15       0.0      1.0  0.0
16       0.0      0.0  1.0
17       0.0      0.0  1.0
18       0.0      0.0  1.0
19       0.0      1.0  0.0
20       0.0      1.0  0.0
21       0.0      1.0  0.0
22       1.0      0.0  0.0
23       0.0      1.0  0.0
24       0.0      1.0  0.0
25       0.0      0.0  1.0
26       0.0      0.0  1.0
27       1.0      0.0  0.0
28       0.0      1.0  0.0
29       0.0      1.0  0.0
      ...      ...  ...
249707   0.0      1.0  0.0
249708   1.0      0.0  0.0
249709   0.0      0.0  1.0
249710   0.0      1.0  0.0
249711   0.0      1.0  0.0
249712   0.0      0.0  1.0
249713   1.0      0.0  0.0
249714   1.0      0.0  0.0
249715   0.0      1.0  0.0
249716   0.0      0.0  1.0
249717   0.0      0.0  1.0
249718   1.0      0.0  0.0
249719   0.0      0.0  1.0
249720   0.0      0.0  1.0
249721   0.0      0.0  1.0
249722   0.0      1.0  0.0
249723   0.0      0.0  1.0
249724   0.0      0.0  1.0
249725   0.0      0.0  1.0
249726   1.0      0.0  0.0
249727   1.0      0.0  0.0
249728   0.0      1.0  0.0
249729   0.0      0.0  1.0
249730   0.0      0.0  1.0
249731   0.0      1.0  0.0
249732   0.0      0.0  1.0
249733   0.0      0.0  1.0
249734   0.0      0.0  1.0
249735   1.0      0.0  0.0
249736   0.0      1.0  0.0
[249737 rows x 3 columns]
sum_ret = zeros_df.sum(axis=0)
print(sum_ret)
Fire        37432.0
Traffic     87465.0
EMS        124844.0
dtype: float64

df = pd.read_csv('911.csv')
# print(df.head(1))
# print(df.info())
#获取分类
temp_list = df.title.str.split(':').tolist()
cate_list = [i[0] for i in temp_list]
df['cate'] = pd.DataFrame(np.array(cate_list).reshape(df.shape[0],1))
print(df.groupby(by='cate').count()['title'])
cate
EMS        124840
Fire        37432
Traffic     87465
Name: title, dtype: int64
五、分布分析
pd.cut(data['col_names'], bins, labels=None)
实例
import numpy
import pandas
from pandas import read_csv
data = read_csv('E:/python/data_analysis/data/dis-cut.csv')
bins = [data['年龄'].min()-1,20,30,40,max(data.年龄)+1]
labels = ['20岁及以下','21岁到30岁','31岁到40岁','41岁以上']
age_cut = pandas.cut(data.年龄,bins,labels=labels)
data['年龄分层'] = age_cut
result = data.groupby(by=['年龄分层'])['年龄'].agg(['size','mean'])
result.rename(columns= {'size': '人数','mean': '平均年龄'})
Out[171]:
            人数       平均年龄
年龄分层
20岁及以下    2061  19.302280
21岁到30岁  46858  25.759081
31岁到40岁   8729  33.095773
41岁以上     1453  50.625602
六、交叉分析


import pandas
from pandas import read_csv
data = read_csv('E:/python/data_analysis/data/pivot_table.csv')
bins = [data['年龄'].min() - 1, 20, 30, 40, max(data.年龄) + 1]
labels = ['20岁及以下', '21岁到30岁', '31岁到40岁', '41岁以上']
age_cut = pandas.cut(data.年龄, bins, labels=labels)
data['年龄分层'] = age_cut
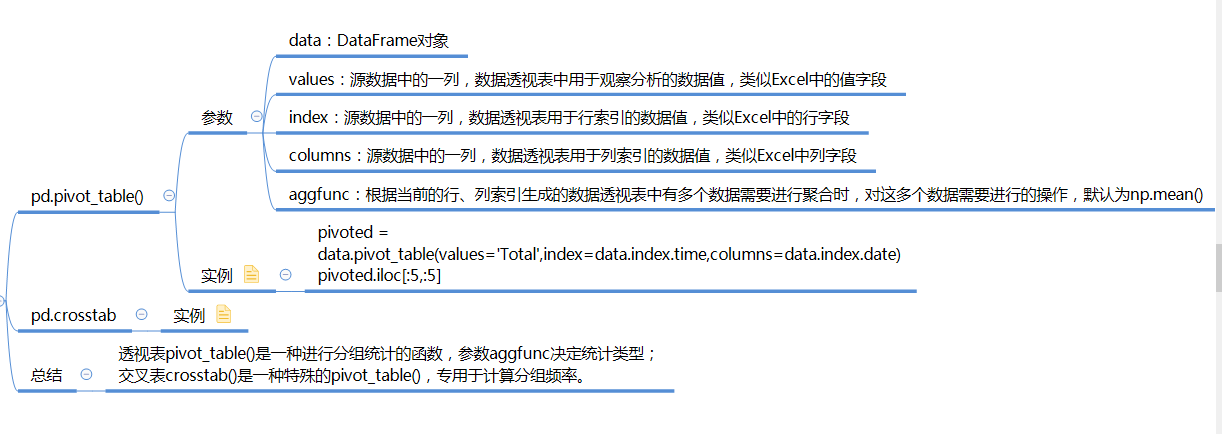
r1 = data.pivot_table(
    values=['年龄'],
    index=['年龄分层'],
    columns=['性别'],
    aggfunc=[numpy.size, numpy.mean]
)
r2 = data.pivot_table(
    values=['年龄'],
    index=['年龄分层'],
    columns=['性别'],
    aggfunc=[numpy.std],
)
print(r1.index)
print(r1['size']['年龄']['女'])
print(r1.join(r2))
CategoricalIndex(['41岁以上', '21岁到30岁', '31岁到40岁', '20岁及以下'], categories=['20岁及以下', '21岁到30岁', '31岁到40岁', '41岁以上'], ordered=True, name='年龄分层', dtype='category')
年龄分层
41岁以上       111
21岁到30岁    2903
31岁到40岁     735
20岁及以下      567
Name: 女, dtype: int64
         size              mean                  std
           年龄                年龄                   年龄
性别          女      男          女          男         女         男
年龄分层
41岁以上     111   1950  18.972973  19.321026  1.708053  1.044185
21岁到30岁  2903  43955  25.954874  25.746149  2.453642  2.361298
31岁到40岁   735   7994  33.213605  33.084939  2.316704  2.200319
20岁及以下    567    886  51.691358  49.943567  6.761848  7.914171

import pandas as pd
import numpy as np
data = pd.DataFrame({'Sample': range(1, 11), 'Gender': ['Female', 'Male', 'Female', 'Male', 'Male', 'Male', 'Female', 'Female', 'Male', 'Female'],
                    'Handedness': ['Right-handed', 'Left-handed', 'Right-handed', 'Right-handed', 'Left-handed', 'Right-handed', 'Right-handed', 'Left-handed', 'Right-handed', 'Right-handed']})
#假设我们想要根据性别和用手习惯对这段数据进行#统计汇总。虽然可以用pivot_table()实现该功#能,但是pandas.crosstab()函数会更方便:
# 方法一:用pivot_table
# 其实我觉的一点都不麻烦ε=(´ο`*)))唉
data.pivot_table(index=['Gender'], columns='Handedness', aggfunc=len, margins=True)
Out[173]:
                Sample
Handedness Left-handed Right-handed All
Gender
Female               1            4   5
Male                 2            3   5
All                  3            7  10
# 方法二:用crosstab
pd.crosstab(data.Gender, data.Handedness, margins=True)
Out[174]:
Handedness  Left-handed  Right-handed  All
Gender
Female                1             4    5
Male                  2             3    5
All                   3             7   10
- 透视表pivot_table()是一种进行分组统计的函数,参数aggfunc决定统计类型;
- 交叉表crosstab()是一种特殊的pivot_table(),专用于计算分组频率。
具体使用参照 https://www.cnblogs.com/onemorepoint/p/8425300.html
七、格式化输出
pandas dataframe数据全部输出,数据太多也不用省略号表示。
pd.set_option('display.max_columns',None)
或者
with option_context('display.max_rows', 10, 'display.max_columns', 5):
    代码逻辑
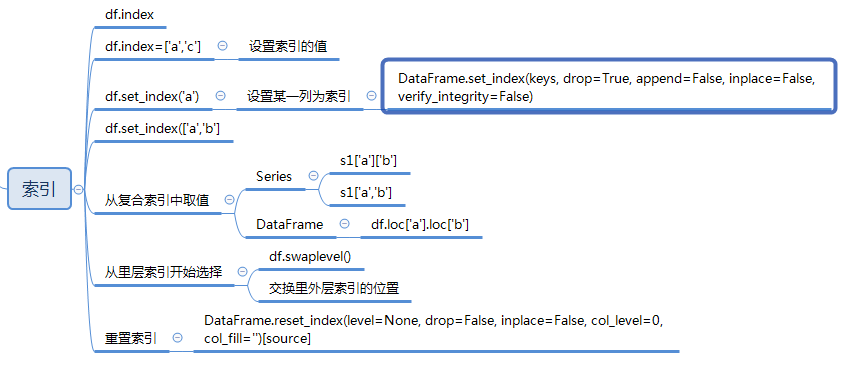
八、索引

