1、配置CAdvisor:
CAdvisor是谷歌开发的用于分析运行中容器的资源占用和性能指标的开源工具。CAdvisor是一个运行时的守护进程,负责收集、聚合、处理和输出运行中容器的信息,他将以容器的方式运行在所有的host上。
{
  "id": "/monitor/cadvisor106",
  "role": "monitor",
  "cmd": null,
  "cpus": 0.1,
  "mem": 256,
  "disk": 0,
  "gpus": 0,
  "instances": 1,
  "constraints": [
    [
      "hostname",
      "CLUSTER",
      "10.20.31.106"
    ]
  ],
  "acceptedResourceRoles": [
    "*"
  ],
  "container": {
    "type": "DOCKER",
    "docker": {
      "forcePullImage": true,
      "image": "10.20.31.104:5000/library/google/cadvisor:latest",
      "parameters": [],
      "privileged": false
    },
    "volumes": [
      {
        "containerPath": "/etc/localtime",
        "hostPath": "/etc/localtime",
        "mode": "RO"
      },
      {
        "containerPath": "/rootfs",
        "hostPath": "/",
        "mode": "RO"
      },
      {
        "containerPath": "/var/run",
        "hostPath": "/var/run",
        "mode": "RO"
      },
      {
        "containerPath": "/sys",
        "hostPath": "/sys",
        "mode": "RO"
      },
      {
        "containerPath": "/dev/disk/",
        "hostPath": "/dev/disk/",
        "mode": "RO"
      },
      {
        "containerPath": "/var/lib/docker",
        "hostPath": "/var/lib/docker",
        "mode": "RO"
      },
      {
        "containerPath": "/cgroup",
        "hostPath": "/cgroup",
        "mode": "RO"
      }
    ],
    "portMappings": [
      {
        "containerPort": 8080,
        "hostPort": 0,
        "labels": {},
        "protocol": "tcp",
        "servicePort": 10130
      }
    ]
  },
  "labels": {
    "HAPROXY_GROUP": "external"
  },
  "networks": [
    {
      "mode": "container/bridge"
    }
  ],
  "portDefinitions": [],
  "maxLaunchDelaySeconds": 300
}

2、配置prometheus:
修改prometheus.yml文件增加如下:
 - job_name: 'docker161'
    scrape_interval: 5s

    file_sd_configs:
      - files: ['/etc/prometheus/fileconfig/docker-nodes161.json']
cat /etc/prometheus/fileconfig/docker-nodes161.json
[
    {
        "targets": ["10.20.31.164:10128"],
        "labels": {
            "instance": "10.20.31.161",
            "alias": "161-docker",
            "job": "docker161"
        }
    }
]
因为是修改了prometheus.yml文件,所以要重新加载一下prometheus服务
curl -XPOST http://10.20.31.100:9090/-/reload
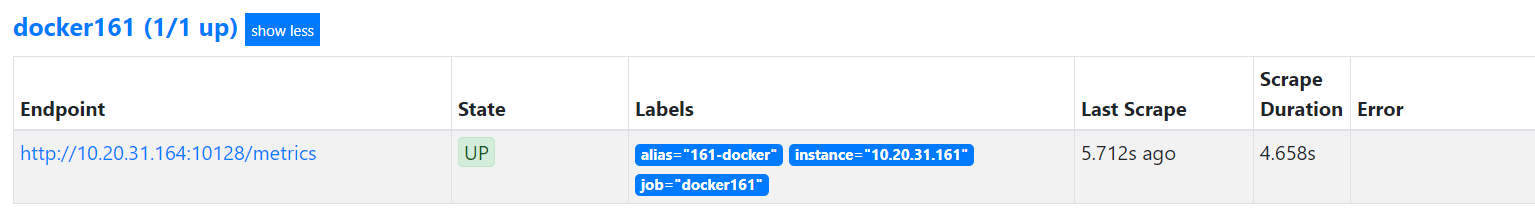
访问prometheus页面——Status——Targets可以查看到刚添加的docker主机信息。
3、配置grafana:
{
  "id": "/grafana",
  "role": "slave_public",
  "cmd": null,
  "cpus": 0.3,
  "mem": 512,
  "disk": 0,
  "gpus": 0,
  "instances": 1,
  "constraints": [
    [
      "hostname",
      "CLUSTER",
      "10.20.31.161"
    ]
  ],
  "acceptedResourceRoles": [
    "*"
  ],
  "container": {
    "type": "DOCKER",
    "docker": {
      "forcePullImage": false,
      "image": "10.20.31.104:5000/library/grafana",
      "parameters": [],
      "privileged": false
    },
    "volumes": [
      {
        "containerPath": "/etc/localtime",
        "hostPath": "/etc/localtime",
        "mode": "RO"
      },
      {
        "containerPath": "/var/lib/grafana",
        "hostPath": "/opt/GrafanaData",
        "mode": "RW"
      }
    ],
    "portMappings": [
      {
        "containerPort": 3000,
        "hostPort": 0,
        "labels": {},
        "protocol": "tcp",
        "servicePort": 10135
      }
    ]
  },
  "labels": {
    "HAPROXY_GROUP": "external"
  },
  "networks": [
    {
      "mode": "container/bridge"
    }
  ],
  "portDefinitions": [],
  "maxLaunchDelaySeconds": 300
}
注意:默认用户名和密码都是 admin。
grafana添加普罗米修斯服务器:
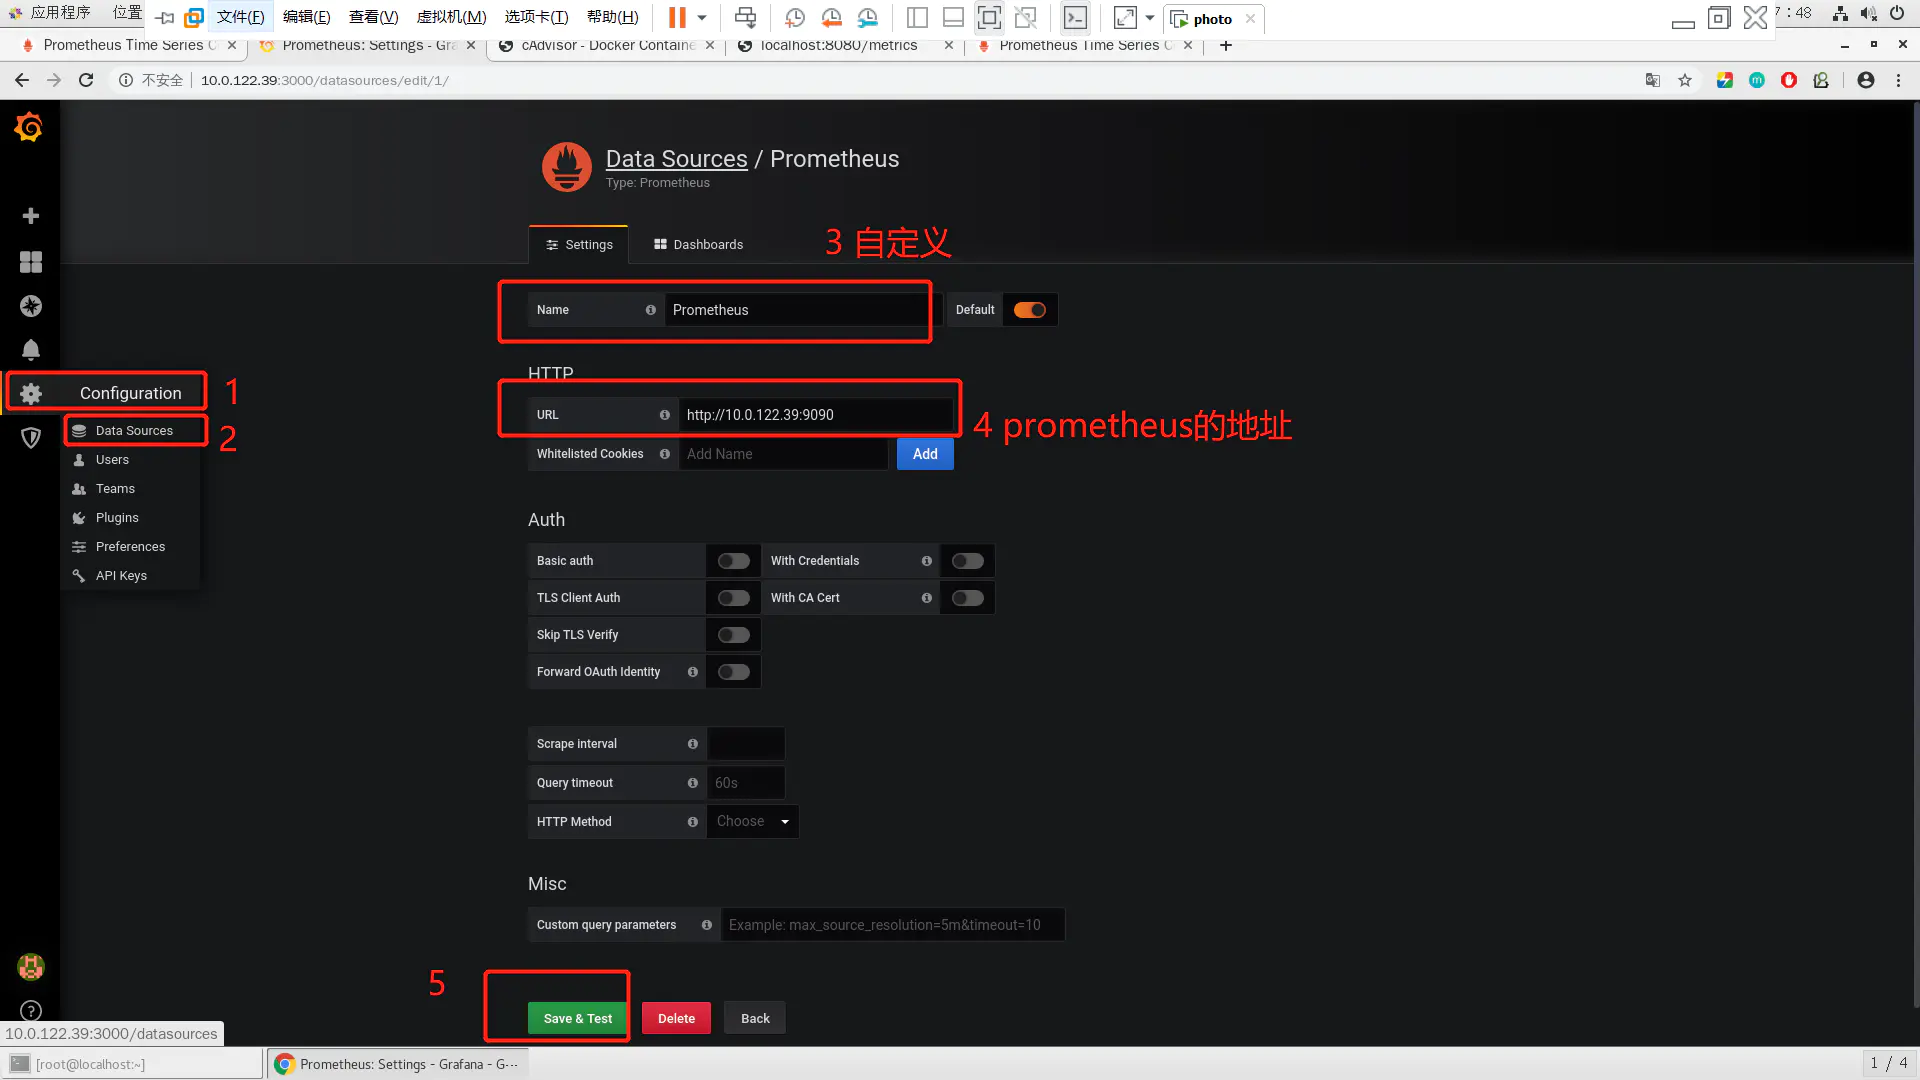
如果一切顺利该DataSource可以正常工作了,也就是说Grafana可以正常跟Prometheus正常通信了,接下来通过dashboard展示数据。
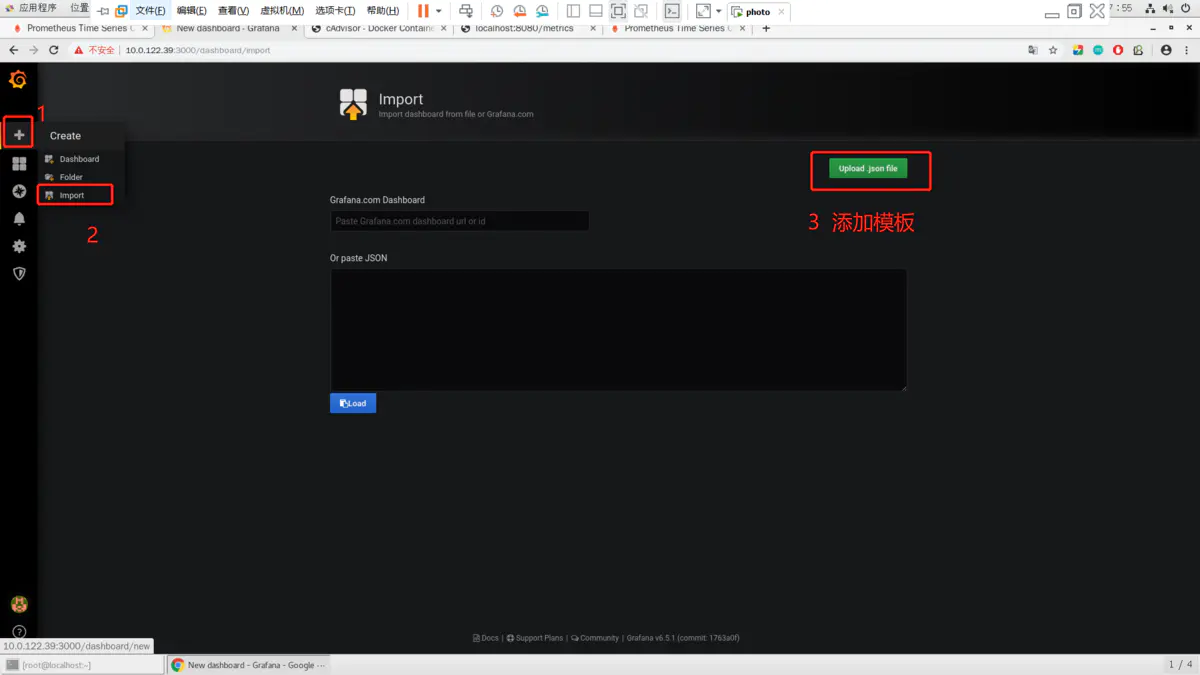
自己手工创建dashboard有点困难,可以借助开元的力量访问 监控模板地址 将会看到很多用于监控 Docker 的 Dashboard。监控模板地址(多种监控模板根据自己需求下载不同的模板)
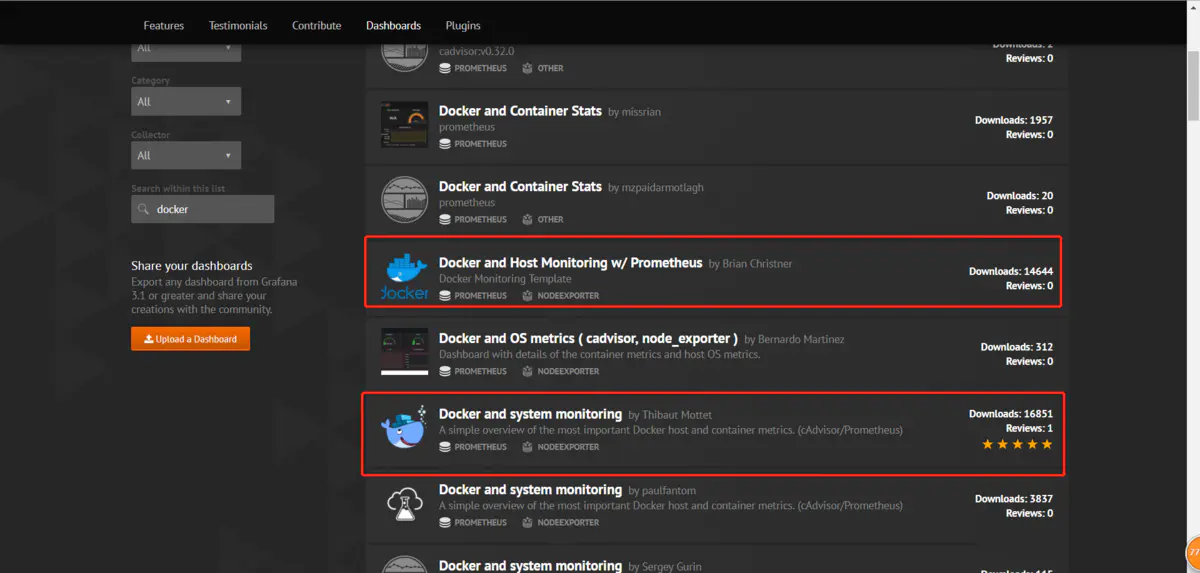
有些dashboard可以下载后直接导入,而有些需要修改后再导入,需要看dashboard的overview
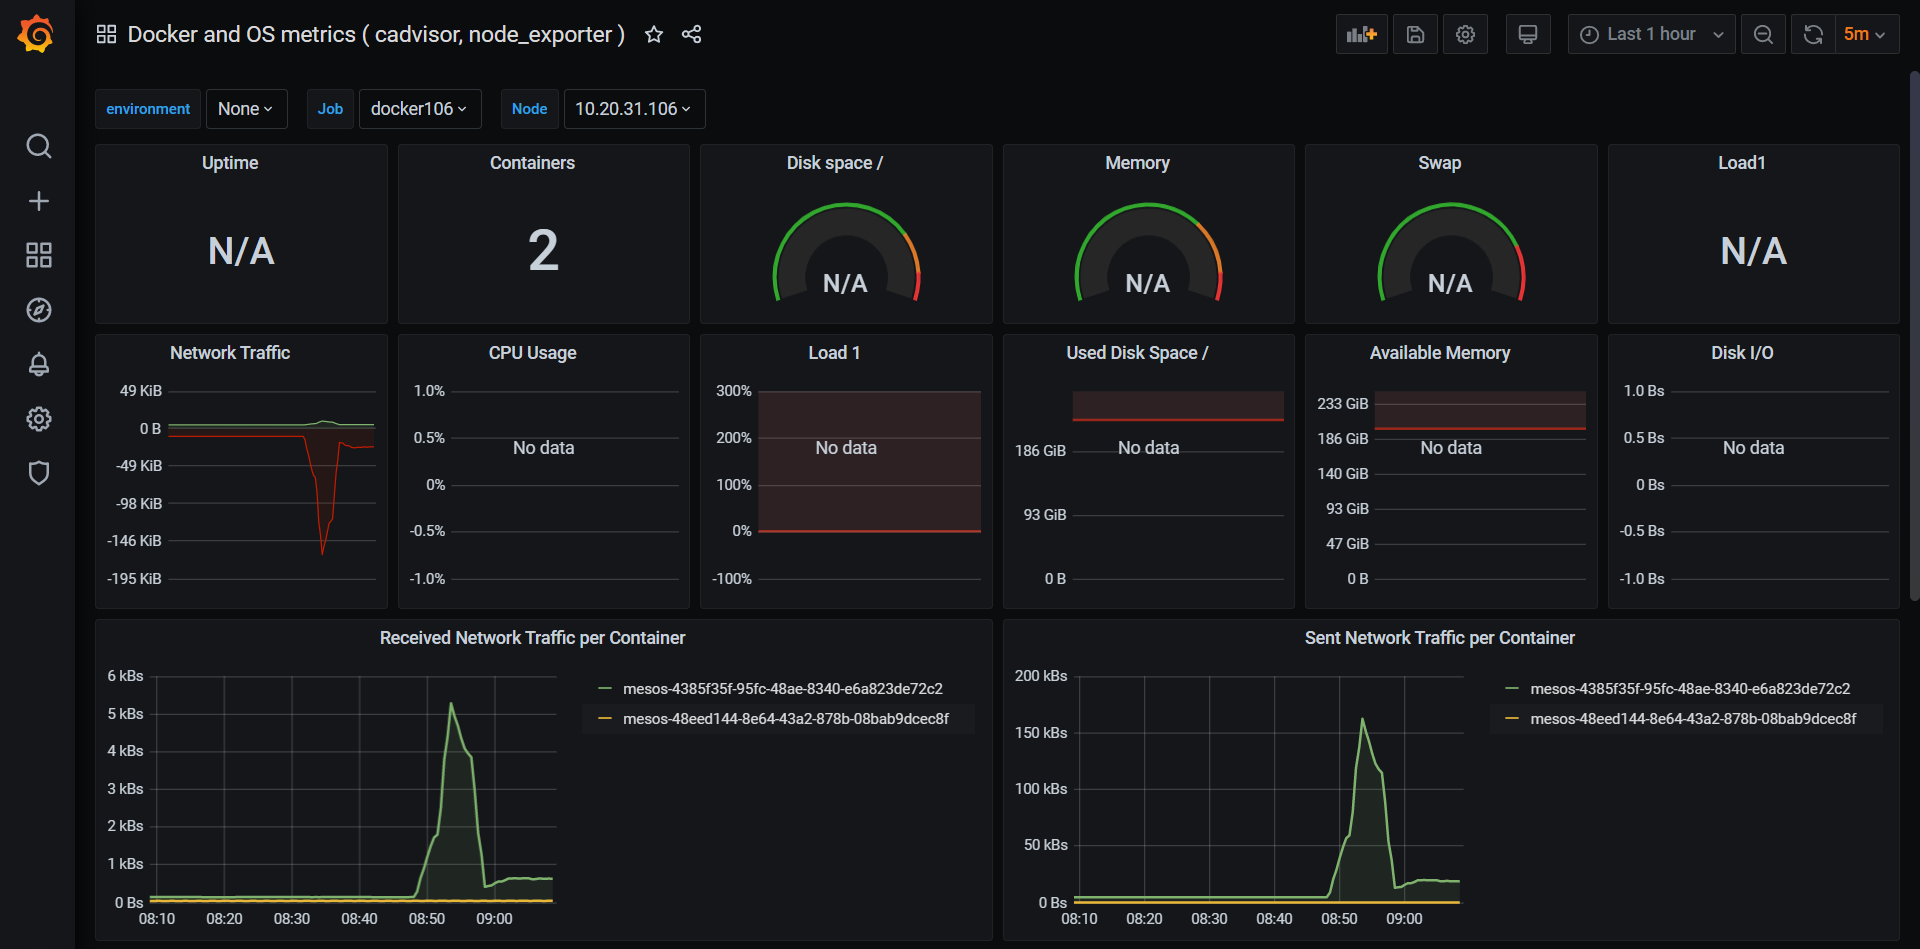
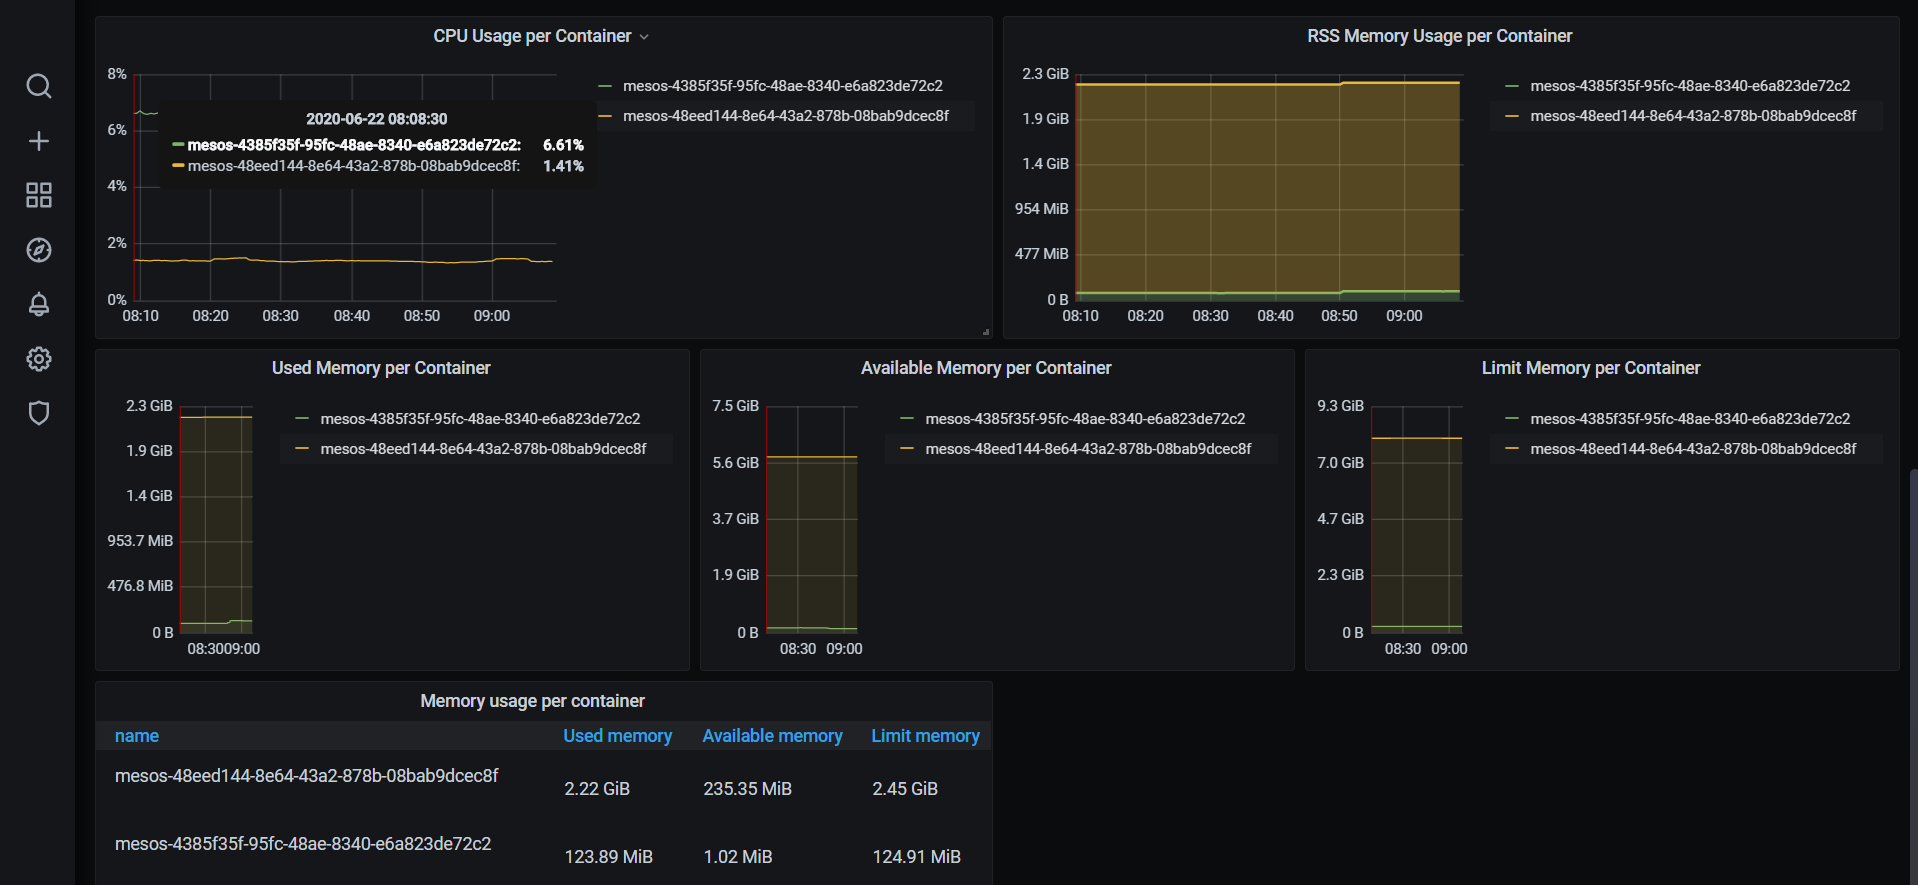
最后效果(首页左上角Home---->dashboards)
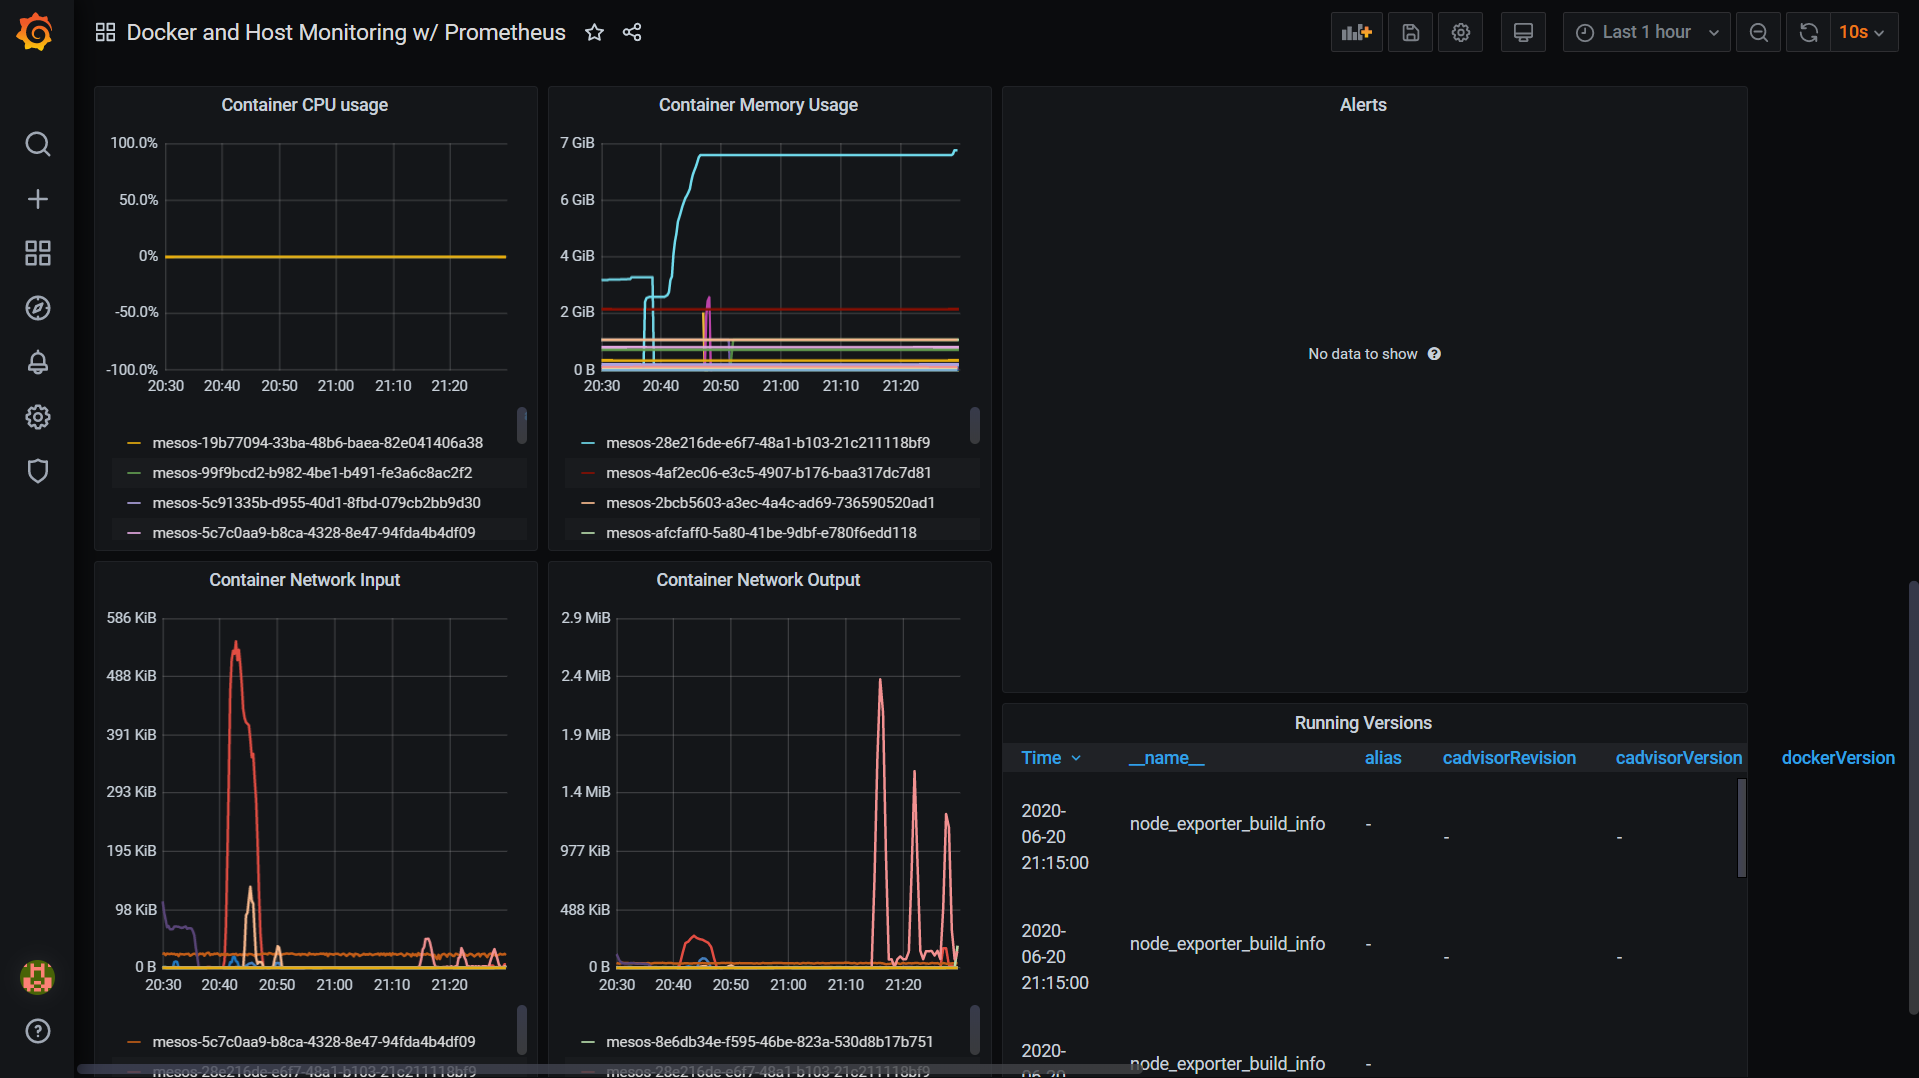
但是这个模板,无法选择根据主机选择。推荐另外一个模板,它是可以选择主机的,并且这个模板指标更多。
https://grafana.com/grafana/dashboards/10566