目录
SNMP原理和实战
SNMP是什么?
snmp(Simple Network Management Protocal, 简单网络管理协议)在架构体系的监控子系统中将扮演重要角色。大体上,其基本原理是,在每一个被监控的主机或节点上 (如交换机)都运行了一个 agent,用来收集这个节点的所有相关的信息,同时监听 snmp 的 port,也就是 UDP 161,并从这个端口接收来自监控主机的指令(查询和设置)。

如果安装 net-snmp,被监控主机需要安装 net-snmp(包含了 snmpd 这个 agent),而监控端需要安装 net-snmp-utils,若接受被监控端通过trap-communicate发来的信息的话,则需要安装net-snmp,并启用trap服务。如果自行编译,需要 beecrypt(libbeecrypt)和 elf(libraryelf)的库。

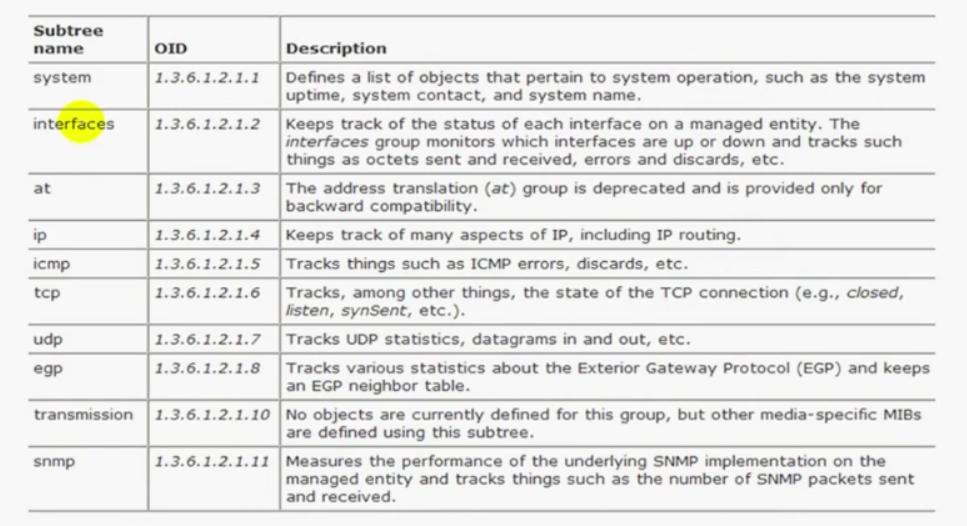
Brief description of the MIB-II groups
SNMP Operations
# Each of the following SNMP operations has a standard PDU format
# snpm 报文
get # 获取一个指定的OID(object identifer)的信息
getnext # 获取某一个节点下的所有子节点的指标信息(节点下必须到指标)
getbulk(SNMPV2 and SNMPV3)  # 获取某一节点下所有子节点下全部信息(节点下是另一个节点,比getnext获取的范围更广)
set # 向控制端发起控制指令,比如:向控制端发起关机指令。
getresponse # 客户端发起响应的命令
trap # trap端发起的命令
notification(SNMPv2 and SNMPv3)
inform(SNMPv2 and SNMPv3)
report(SNMPv2 and SNMPv3)
Host Management Revisited
# Managing your hosts is an important part of network management
# The Host Resources MIB defines the follwing seven groups:
host OBJECT IDENTIFIER ::={mib-2 25}
hrSystem OBJECT IDENTIFIER ::={host 1}
hrStorage OBJECT IDENTIFIER ::={host 2}
hrDevice OBJECT IDENTIFIER ::={ host 3}
hrSWRun OBJECT IDENTIFIER ::={ host 4} # 获取的是操作系统的版本号
hrSWRunPerf OBJECT IDENTIFIER ::={ host 5} # 系统的性能
hrSWInstalled OBJECT IDENTIFIER ::={ host 6} # 在操作系统上装了哪些软件
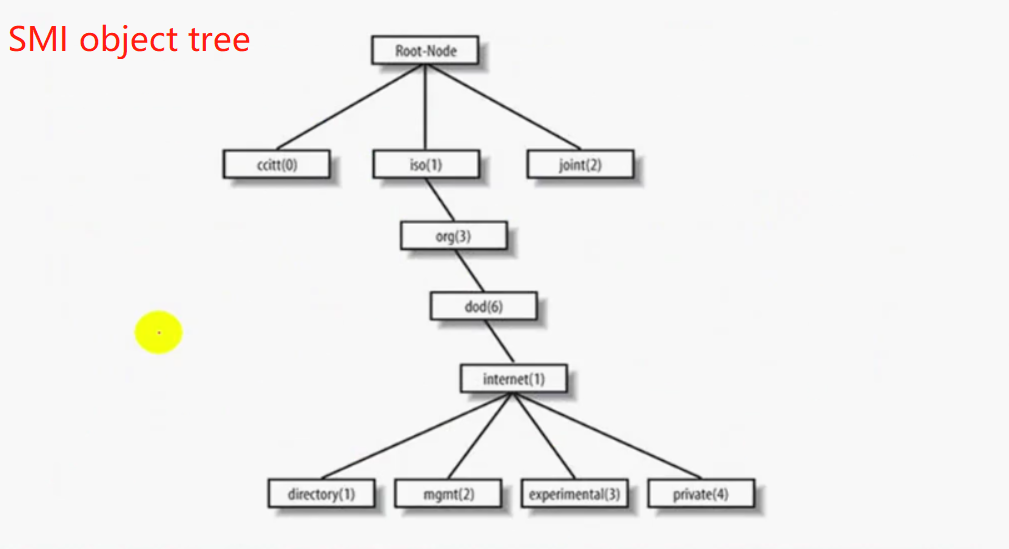
The host OID is 1.3.6.1.2.1.25
(iso.org.dod.internet.mgmt.mib-2.host)
The hrSystem(1.3.6.1.2.1.25.1)group defines objects that pertain to the system itself.These objects inclede uptime system date,system users,and system processes
The hrDevice(1.3.6.1.2.1.25.3) and hrStorage(1.3.6..1.2.1.25.2) groups define objects pertaining to filesystems and system storage,such as total system memory,disk utilization,and CPU nonidle percentage.
The hrSWRun(1.3.6..1.2.1.25.4),hrSWRunPerf(1.3.6.1.2.1.25.5),and hrSWInstalled(1.3.6.1.2.1.25.6) groups define objects that represent various aspects of software running or installed on the system
From these groups,you can determine what operating system is running on the host,as well as what programs the host is currently running
The hrSWInstalled group can be used to track which software packages are installed
net-snmp(Agent):主要用在被监控端
net-snmp-utils(NMS:command):监控端所用到的命令都在这个包,比如: get set
如果我们要接收被监控端的通过trap community发来的信息的话,我们的监控端就必须要安装 net-snmp包,并启用net-snmp包中的/usr/lib/systemd/system/snmptrapd.service 服务
yum install -y net-snmp net-snmp-utils
net-snmp包文件介绍:
/etc/snmp/snmpd.conf 为agent用的
/etc/sysconfig/snmpd
/etc/sysconfig/snmptrapd
snmpwalk -v 1 -c public localhost host
cd /usr/share/snmp/mibs
snmpwalk -v 1 -c public localhost HOST-RESOURCES-MIB::hrSystemUptime.0
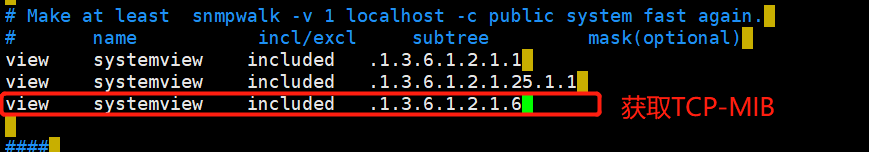
# 配置mib库,以/usr/share/snmp/mibs/SNMPv2-MIB.txt库为例
less SNMPv2-MIB.txt # 得到对应的OID号为6 mib-2 6
vim /etc/snmp/snmpd.conf
view systemview included .1.3.6.1.2.1.6
systemctl restart snmpd
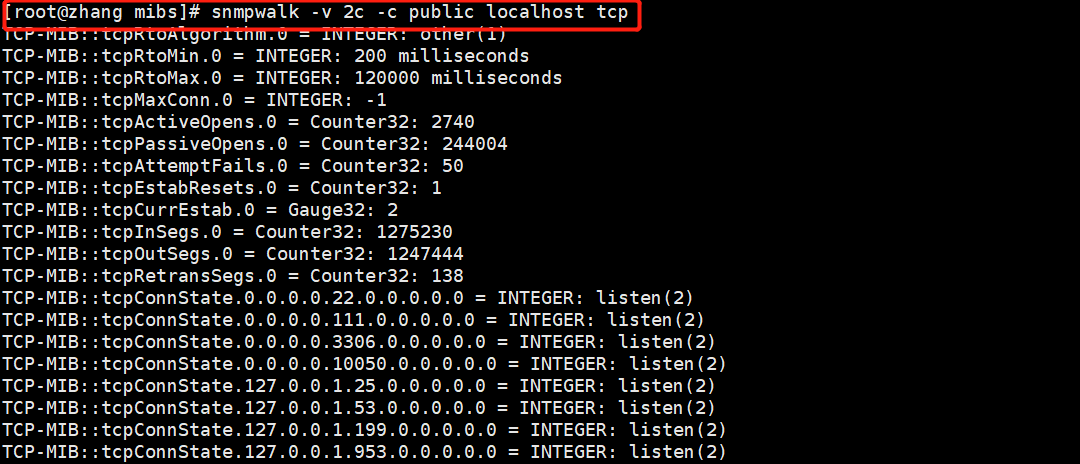
snmpwalk -v 2c -c public localhost tcp
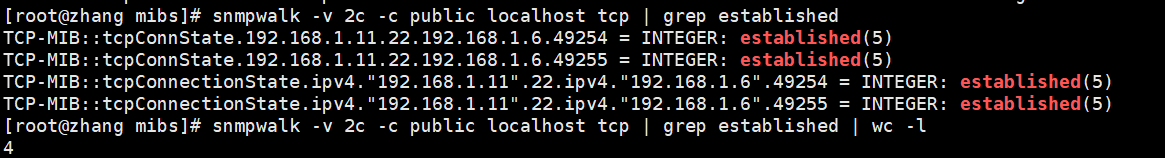
snmpwalk -v 2c -c public localhost tcp | grep established | wc -l
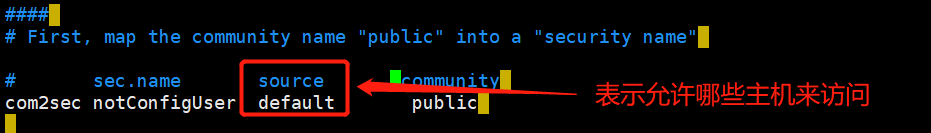
配置允许哪些主机来访问
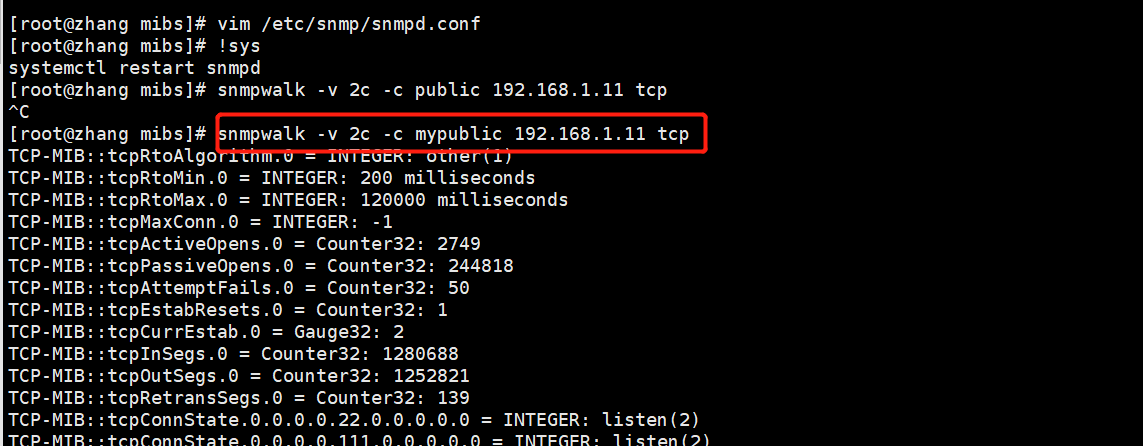
vim /etc/snmp/snmpd.conf

#       sec.name       source       community
com2sec notConfigUser  127.0.0.1    mypublic   # community尽量配置的复杂一点,不要让别人知道。 此时只允许本地访问


# 配置允许某一个网段来访问
#       sec.name       source       	community
com2sec notConfigUser  192.168.1.0/24     mypublic
p配置主机允许某一个网段访问
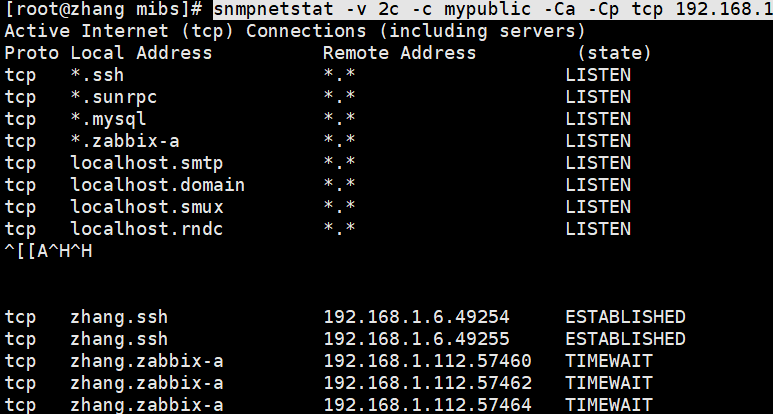
snmpnetstat
snmpnetstat -v 2c -c mypublic -Ca -Cp tcp 192.168.1.11 # 获取指定主机上建立的TCP链接
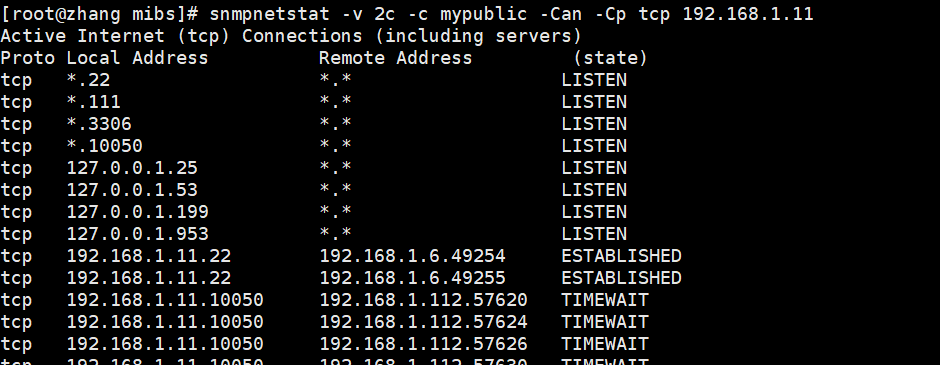
snmpnetstat -v 2c -c mypublic -Can -Cp tcp 192.168.1.11 # 以数字的方式显示IP地址,不然还要反解成主机名

RRDTool(RoundRobinDatabaseTool)
环状数据库官方文档:https://oss.oetiker.ch/rrdtool/doc/rrdgraph_graph.en.html
RRDTool 是一套监测工具,可用于存储和展示被监测对象随时间的变化情况。比如,我们在 Windows 电脑上常见的内存和 CPU 使用情况。

RRD 全称是 Round Robin Database ,即「环型数据库」。顾名思义,它是一种循环使用存储空间的数据库,适用于存储和时间序列相关的数据。
RRD 数据库在被创建的时候就已经定义好了大小,当空间存储满了以后,又从头开始覆盖旧的数据,所以和其他线性增长的数据库不同,RRD 的大小可控且不用维护。

Rrdtool是环形数据库工具,存储和读取的是环形数据库,表现是后缀为.rrd的二进制文件。要大概理解啥是环形数据库,我对它的理解就是把它想象成圆形的时钟,随着时间推移,不断往里写数据,同时有个标记指向当前数据记录的最新位置,就像时钟上的指针指示当前时间一样。又因为它是圆形的,无始无终,可以一直往里写数据,只是历史数据会被覆盖掉,所以,有时它又被叫做时序结构数据库。

rrdtool的三个常用命令create、update、graph

# Create命令格式: set up a new round robin database
rrdtool create filename [--start|-b start time] [--step|-s step] [--template|-t template-file] [--source|-r source-file] [--no-overwrite|-O] [--daemon|-d address] [DS:ds-name[=mapped-ds-name[[source-index]]]:DST:dst arguments] [RRA:CF:cf arguments]

--start|-b start time (default:now-10s)
--step|-s step (default:300 seconds)
RRA:round robin archive,轮转归档信息
CF:consolidation function,聚合函数

DS:ds-name:DST:dst arguments
	A single RRD can accept input form several data sources (DS)
	ds-name is the name you will use to reference this particular data source from an RRD
		A ds-name must be 1 to 19 characters long in the characters [a-zA-Z0-9]
	DST defines the Data Source Type
		For GAUGE,COUNTER,DERIVE,and ABSOLUTE the format for a data source entry is:
			DS:ds-name:GUAGE | COUNTER | DERIVE | ABSOLUTE:heartbeat:min:max # 不知道min,max;可以定义为:U:U,表示不限定值得范围
				heartbeat:当数据没按照我们指定的时间到来,比如每5s接收一个数据,结果这个数据第7s才到,这时候我们是把这个数据放到哪个时间槽上呢?如果是第10s这个数据才到,我们将这个数据是放到当前时间槽还是下一个时间槽上呢?所以,这个heartbeat就是决定我们的数据没有正常接收,这个值是决定我们的将到来的数据放到哪个时间槽上。比如我们可以定义只要在10s以内就还放在当前时间槽上,如果大于10s,就放到下一个时间槽上。
				min,max:确定可以接收的数据的范围,超出这个范围不接收。如果不知道接收数据的准确值是否在这个范围,就是UNKNOWN
				heartbeat defines the maximum number of seconds that may pass between two updates of this data source before the value of the data source is assumed to be *UNKNOWN*
				min and max define the expected range values for data supplied by a data source

		For COMPUTE data sources,the format is :
			DS:ds-name:COMPUTE:rpn-expression

		初始值:1
		2 3 6 9
		GUAGE:2 3 6 9
		COMPUTE:1 1 3 3
         DERIVE:1 1 3 3 # 可以允许前后两个数值之差为负数
		ABSOLUTE: 1 2 5 8 # 相对于初始值

		保存网卡流量可以使用COUNTER(只增不减),保存温度使用DERIVE,GUAGE保存初始值和原有值

# Update命令格式:store new data values into an RRD 在指定的时间范围内向rrdtool create创建的数据库中提供数据
rrdtool {update | updatev} filename [--template|-t ds-name[:ds-name]...] [--skip-past-updates|-s] [--daemon|-d address] [--] N:value[:value]... timestamp:value[:value]... at-timestamp@value[:value]...

# Graph命令格式:Create a graph from data stored in one or several RRDs.Apart from generatin graphs,data can also be extracted yo stdout
rrdtool graph|graphv filename [option ...] [data definition ...] [data calculation ...] [variable definition ...] [graph element ...] [print element ...]

	filename:生成的图片的名称,默认生成的都是.png的图片

	[-s|--start time] [-e|--end time] [-S|--step seconds] # 起始日期、解析度
	[-t|--title string] [-v|--vertical-label string] # 标题,纵向坐标轴名称
	[-w|width pixels] [-h|height pixels] [-j|--only-graph] [-D|--full-size-mode] # 图片的宽度、高度、只显示图片、全图
	[-u|--upper-limit value] [-l|--lower-limit value] [-r|--rigid] # 刻度的上下限, -r 不允许缩放
	[-A|--alt-autoscale] # 自动缩放
	[-J|--alt-autoscale-min] # 只自动缩放最小值
	[-M|--alt-autoscale-max] # 只自动缩放最大值
	[-N|--no-gridgit] # 不显示网格线
	X-Axis # 用于定制横轴的标识符
		[-x|--x-grid GTM:GST:MTM:MST:LTM:LST:LPR:LFM]  # GTM(单位):GST(时间值)基准网格线跨度,MTM:MST 主网格线,LTM:LST 横轴的标签,LPR:LFM 横轴上多长时间显示一个标签
		[-x|--x-grid none]
		e.g --x-grid MINUTE:10:HOUR:1:HOUR:4:0:%X  # %X 指定时间格式
	y-Axis # 用于定制纵轴的标识符
		[-y|--y-grid grid step:label factor] # step每隔多长显示一个纵轴刻度 label卷标,factor显示卷标时,每隔多长时间显示一次
		[-y|--y-grid none]
		[-Y|--alt-y-grid]

	Miscellaneous
		[-c|--color COLORTAG#rrggbb[aa]]
			BACK background
			CANVAS for the background of the actual graph
			SHADEA for the left and top border
			SHADEB for the right and bottom border
			GRID,MGRID for the major grid
			FONT for the color of the font
			AXIS for the axis of the graph
			FRAME for the line around the color spots
			ARROW for the arrow head pointing up and forward

		-n|--font FONTTAG:size:[font]
		[-R|--font-render-mode {normal,light,mono}]
		[-a|--imagformat PNG|SVG|EPS|PDF] # 默认是png
		[-W|--watermark string]	# 给图片打水印
	# Data and variables
    DEF:vname=rrdfile:ds-name:CF[:step=step][:start=time][:end=time]
    CDEF:vname=RPN expression
    VDEF:vname=RPN expression
        You need at least one DEF and one LINE,AREA,GPRINT,PRINT statement to generate anything useful

    # 画折线图还是面积图?
    # 画折线图
    LINE [width]:value[#color][:[legend][:STACK]][:dashes[=on_s[off_s[on_s,off_s]...]][:dash-offse=offset]]

    # 画面积图
    AREA:value[#color][:[:legend][:STACK]]
        width can be a floating point number
        If the color is not specified,the drawing is done 'invisibly'
        Also optional is the legend box and string which will be printed in the legend section if specified
        The value can be generated by DEF,VDEF,and CDEF
        if the optional STACK modifier is used,this line is stacked on top of the previous element which can be a LINE or an AREA

updatav: Operationally equivalent to updata except for output

dump: Dump the contents of an RRD in plain ASCII.In connection with restore you can use this to move an RRD from one computer architecture to another

restore: Restore an RRD in XML format to a binary RRD

fetch: Get data for a certain time period from a RRD. The graph function uses fetch to retrieve its data from an RRD

tune: Alter setup of an RRD

last: Find the last updte time of an RRD

info: Get information about an RRD

rrdresize: Change the size of individual RRAs

xport: Export data retrieved from one or several RRDs

flushcached: Flush the values for a specific RRD file from memory

rrdcgi: This is a standalone tool for producing RRD graphs on the fly
# RRA后携带的参数

The purpose of an RRD is to store data in the round robin archives(RRA)

RRA:AVERAGE | MIN | MAX | LAST:xff:steps:rows
	1.xff The xfiles factor defines what part of a consolidation interval may be made up from *UNKNOWN* data while the consolidated value is still regarded as known
		xff后定义的是我所使用的聚合函数的PDP当中有多大的比例为NUKNOWN,要小于这个比例,我们就能猜出这个CDP。
		steps:表示对多少个PDP为一组进行聚合
		rows:表示取多少个CDP。比如我们每5s取一个PDP,每10个PDP取一个RRA(聚合函数),我们至少要保存2天的RRA,如何计算要保存多少行?86400*2/5/10
	2.It is given as the ratio of allowed "UNKNOWN" PDPs to the number of PDPs in the interval. Thus, it ranges from 0 to 1(exclusive)
	3.steps defines how many of these primary data points are used to build a consolidated data point which then goes into the archive
	4.rows defines how mnay generations of data values are kept in an RRA.
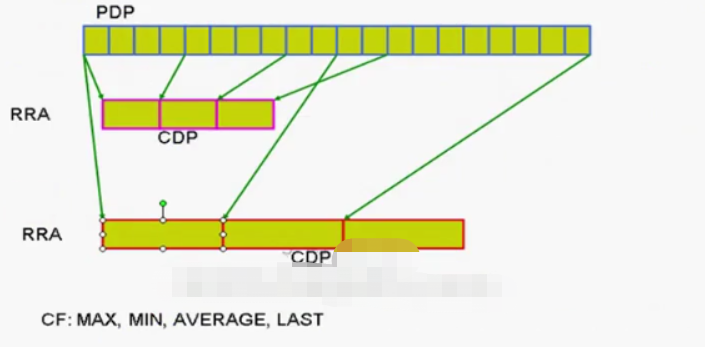
PDP:Primary Data Point,主数据节点,存储在每个时间槽上的数据,这个数据并不是我们关心的数据,我们需要对这些数据做聚合函数计算,比如:每两两为一组取平均值,这个这个平均值所在的时间槽数据去画图

CDP:Consolidation Data Point,聚合数据节点

resolution:解析度,表示每几个PDP为一组参与聚合
rrdtool工具安装及使用
rrdtool不是系统标准带的,需要下载、编译、安装;或者直接使用rpm安装rpm包
yum install -y rrdtool rrdtool-devel rrdtool-perl
rrdtool create test.rrd --step 5 DS:testds:GAUGE:8:0:U RRA:AVERAGE:0.5:1:17280 RRA:AVERAGE:0.5:10:3456 RRA:AVERAGE:0.5:100:1210 # --step 5 表示每5秒钟接收一个值,不指定默认是300s
rrd info test.rrd # 查看文件的格式,如下图2
rrdtool create test.rrd DS:ds1 DS:ds2 # DS代表数据源:data source,可以有多个
rrdtool update test.rrd N:30:40 # N代表当前时间,30传给了ds1,40传给了ds2;也可以指定时间,可以是相对时间、绝对时间、时间戳
rrdtool update test.rrd -t ds2:ds1 40:30 # 如果想自己指定数据源顺序 使用-t 选项
rrdtool update test.rrd N:$RANDOM
rrdtool fetch test.rrd AVERAGE # 从一个数据源中取数据
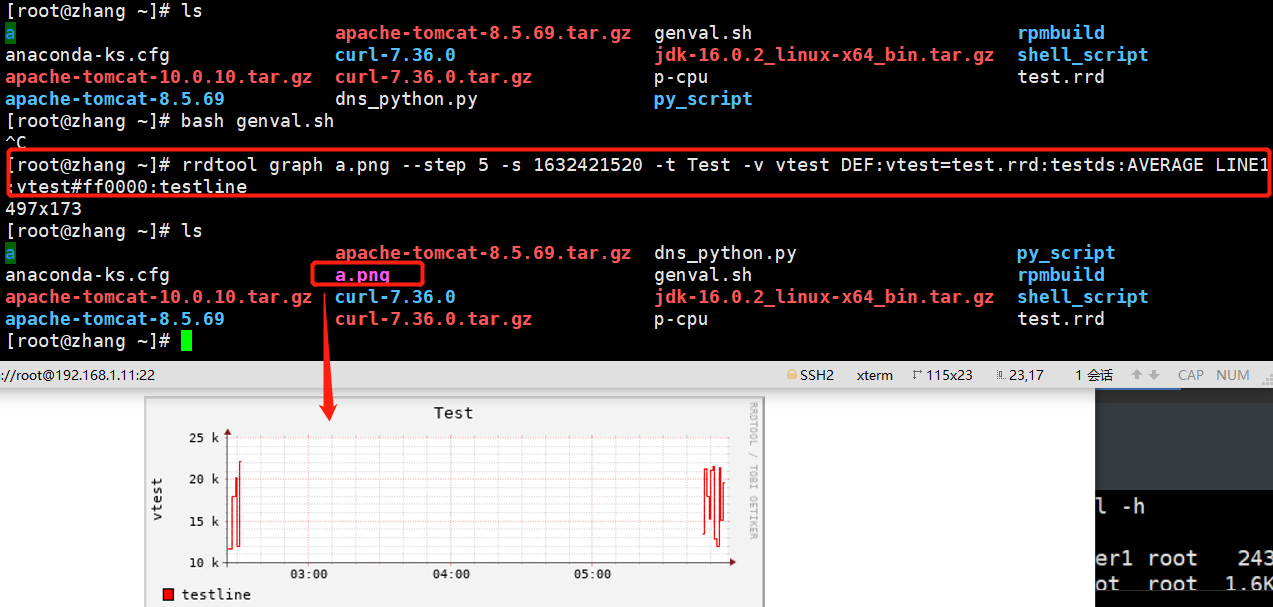
rrdtool graph a.png --step 5 -s 1632421520 -t Test -v vtest DEF:vtest=test.rrd:testds:AVERAGE LINE1:vtest#ff0000:testline # 如图3
# 将step 5 和step 50 画在同一张图上
rrdtool graph b.png --step 5 -s 1632421520 -t Test -v vtest DEF:vartest=/root/test.rrd:testds:AVERAGE:step=50 DEF:vartest2=/root/test.rrd:testds:AVERAGE:step=50 LINE1:vartest#FF0000:"testline" LINE1:vartest2#00FF00:"testline2"
图1:
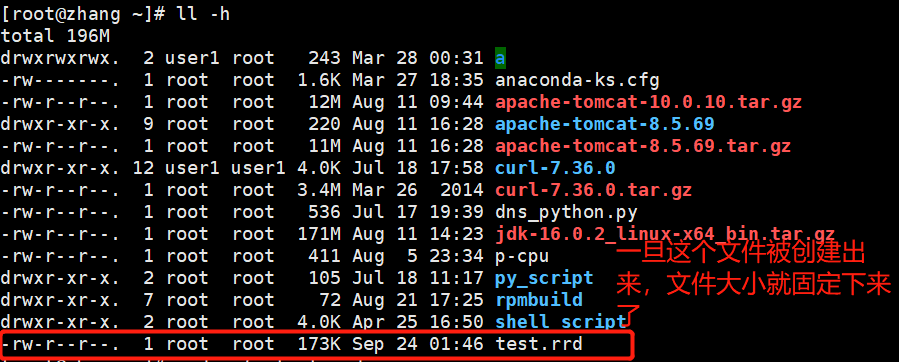
图2:
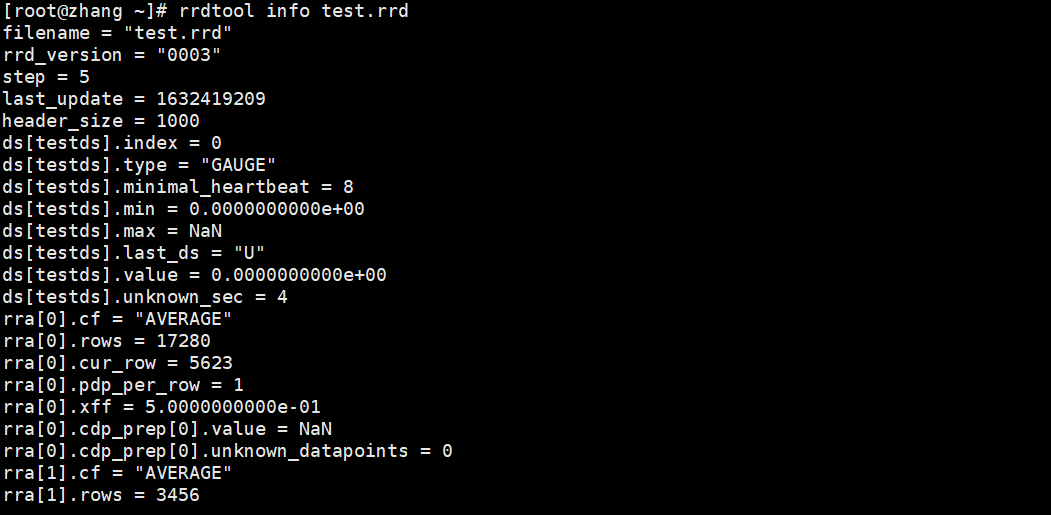
图3:
案例:写一个脚本连续向test.rrd文件中填充随机数据
vim genval.sh
	#!/bin/bash
    #
    while true;do
      rrdtool update test.rrd N:$RANDOM
      sleep 5
    done

bash -n genval.sh # 测试脚本
bash -x genval.sh # 单步执行脚本

rrdtool fetch -r 5 test.rrd AVERAGE  # -r 指定解析度,在我们创建test.rrd的时候指定的有每隔5s,10s,50s,当我们所指定的解析度不是我们create时所定义的,那么将选择解析度更高的展示。比如:-r 7,实际展示的是 -r 5。


rrdtool还具有强大的绘图功能,可以根据上面fetch的数据进行绘图。。。。
案例:mysql服务器每5s、50s、500s发生的查询次数(聚合)的图:
rrdtool create mysql.rrd --step 3 DS:myselect:COUNTER:5:0:U RRA:AVERAGE:0.5:1:28800 RRA:AVERAGE:0.5:10:2880 RRA:MAX:0.5:10:2880 RRA:LAST:0.5:10:2880
# 可以用shell脚本操作mysql数据库,使用mysql的-e参数可以执行各种sql的(创建,删除,增,删,改、查)等各种操作 。
# -e 相关mysql的sql语句,不用在mysql的提示符下运行mysql,即可以在shell中操作mysql的方法。
# 参考示例:https://blog.csdn.net/feeltouch/article/details/46643065
mysql -e "SHOW GLOBAL STATUS LIKE 'com_select'"
mysql --batch -e "SHOW GLOBAL STATUS LIKE 'com_select'" # --batch 去掉查询结果的表格线
mysql --batch -e "SHOW GLOBAL STATUS LIKE 'com_select'" | awk '/Com_select/{print $2}'
编辑一个脚本,每隔3s查询一次com_select,并将结果写入到rrd:
vim getselect.sh
#!/bin/bash
#
while true;do
SELECT=`mysql --batch -e "SHOW GLOBAL STATUS LIKE 'com_select'" | awk '/Com_select/{print $2}'`
rrdtool update mysql.rrd N:$SELECT
sleep 3
done
vim insert.sh
#!/bin/bash
#
for I in {1..200000};do
mysql -e "insert into testdb.tb1(name) values ('stu$I')"
mysql -e "select * from testdb.tb1" &> /dev/null
done
rrdtool fetch -r 5 mysql.rrd AVERAGE # -r 解析度
rrdtool fetch -r 30 mysql.rrd AVERAGE
rrdtool fetch -r 30 mysql.rrd AVERAGE
rrdtool fetch -r 5 mysql.rrd MAX
rrdtool last mysql.rrd # 显示上一个值在哪个时间点插入的
# 每3s的平均值 如图1
rrdtool graph mysql.png -s 1632448590 -t "mysql select" -v "selects/3" DEF:select3=mysql.rrd:myselect:AVERAGE:step=3 LINE1:select3#FF0000:"select"
# 每30s的平均值
rrdtool graph mysql.png -s 1632448590 -t "mysql select" -v "selects/30" DEF:select30=mysql.rrd:myselect:AVERAGE:step=30 LINE1:select30#FF0000:"select"
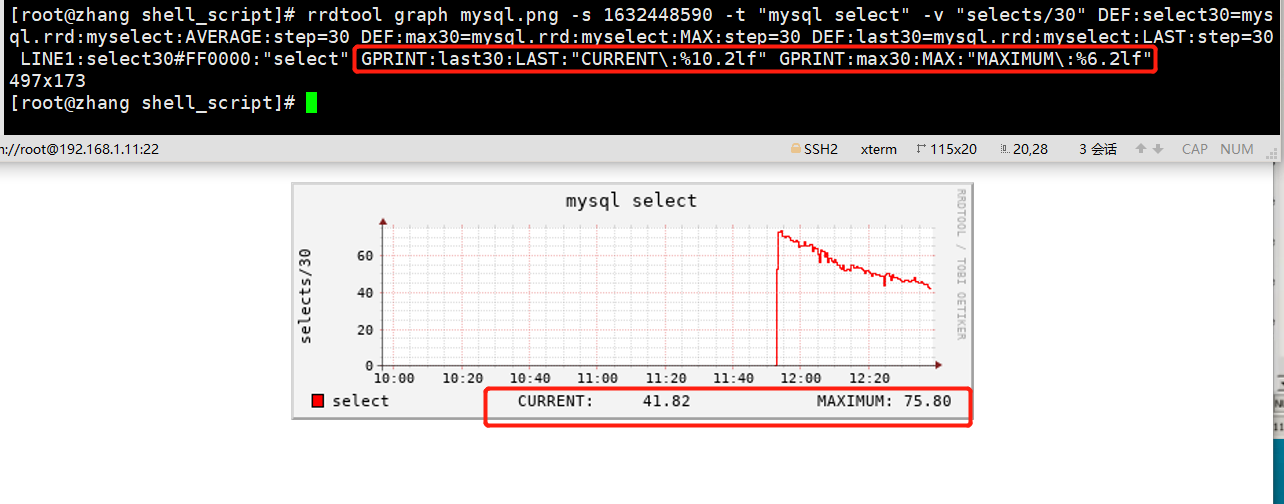
# 除了希纳是30s的平均值,还显示当前值和最大值 如图2
rrdtool graph mysql.png -s 1632448590 -t "mysql select" -v "selects/30" DEF:select30=mysql.rrd:myselect:AVERAGE:step=30 DEF:max30=mysql.rrd:myselect:MAX:step=30 DEF:last30=mysql.rrd:myselect:LAST:step=30 LINE1:select30#FF0000:"select" GPRINT:last30:LAST:"CURRENT:%10.2lf" GPRINT:max30:MAX:"MAXIMUM:%6.2lf"
图1:
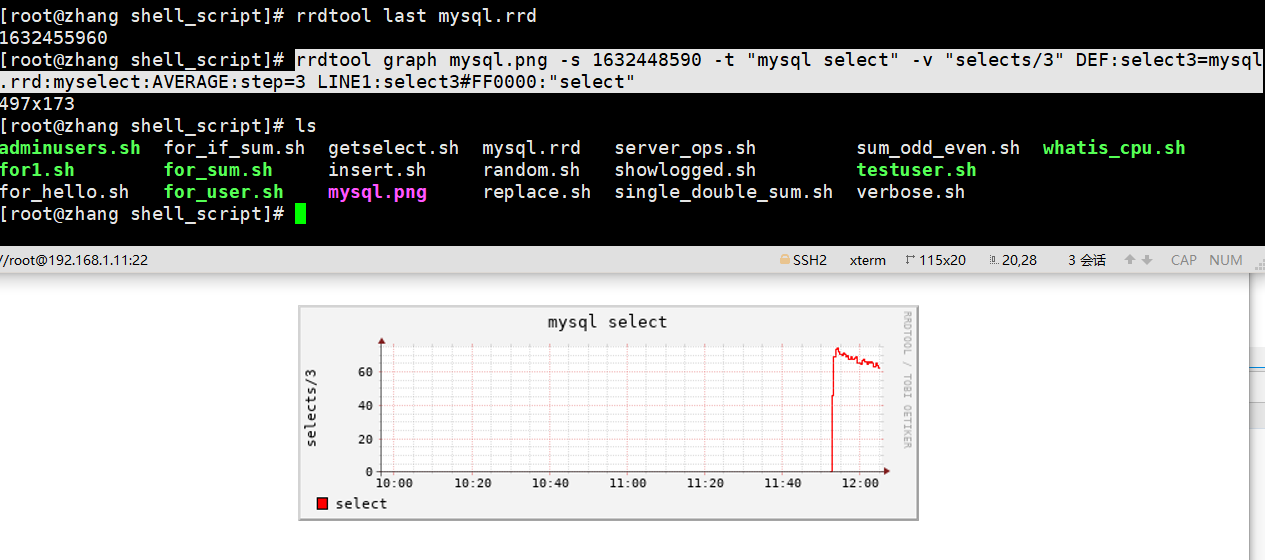
图2: