1. 说明
本文描述如何搭建prometheus+grafana+alertmanager监控系统,目标是检测到cpu使用率过高之后能发送短信通知相关人员
1. prometueus搭建
开源的系统监控和报警框架,灵感源自Google的Borgmon监控系统
1.1. docker-compose配置
记得把./prometheus/data的权限设置为777
    prometheus:
        image: prom/prometheus:v2.36.2
        container_name: prometheus
        restart: always
        network_mode: default_network
        logging:
            driver: "json-file"
            options:
                max-size: "200m"
                max-file: "10"
        volumes:
            - ./prometheus/prometheus.yml:/etc/prometheus/prometheus.yml
            - ./prometheus/rules:/etc/prometheus/rules
            - ./prometheus/data:/prometheus
        ports:
            - "0.0.0.0:9090:9090"
1.2. 配置
需要配置检测rules规则文件,node-exporter和alertmanager的地址
# my global config
global:
  scrape_interval: 15s # Set the scrape interval to every 15 seconds. Default is every 1 minute.
  evaluation_interval: 15s # Evaluate rules every 15 seconds. The default is every 1 minute.
  # scrape_timeout is set to the global default (10s).

# Alertmanager configuration
alerting:
  alertmanagers:
    - static_configs:
        - targets:
          - 10.0.22.120:9093
          # - alertmanager:9093

# Load rules once and periodically evaluate them according to the global 'evaluation_interval'.
rule_files:
  - 'rules/*_rules.yml'
  # - "first_rules.yml"
  # - "second_rules.yml"

# A scrape configuration containing exactly one endpoint to scrape:
# Here it's Prometheus itself.
scrape_configs:
  # The job name is added as a label `job=<job_name>` to any timeseries scraped from this config.
  - job_name: "prometheus"

    # metrics_path defaults to '/metrics'
    # scheme defaults to 'http'.

    static_configs:
      - targets: ["10.0.22.120:9100"]
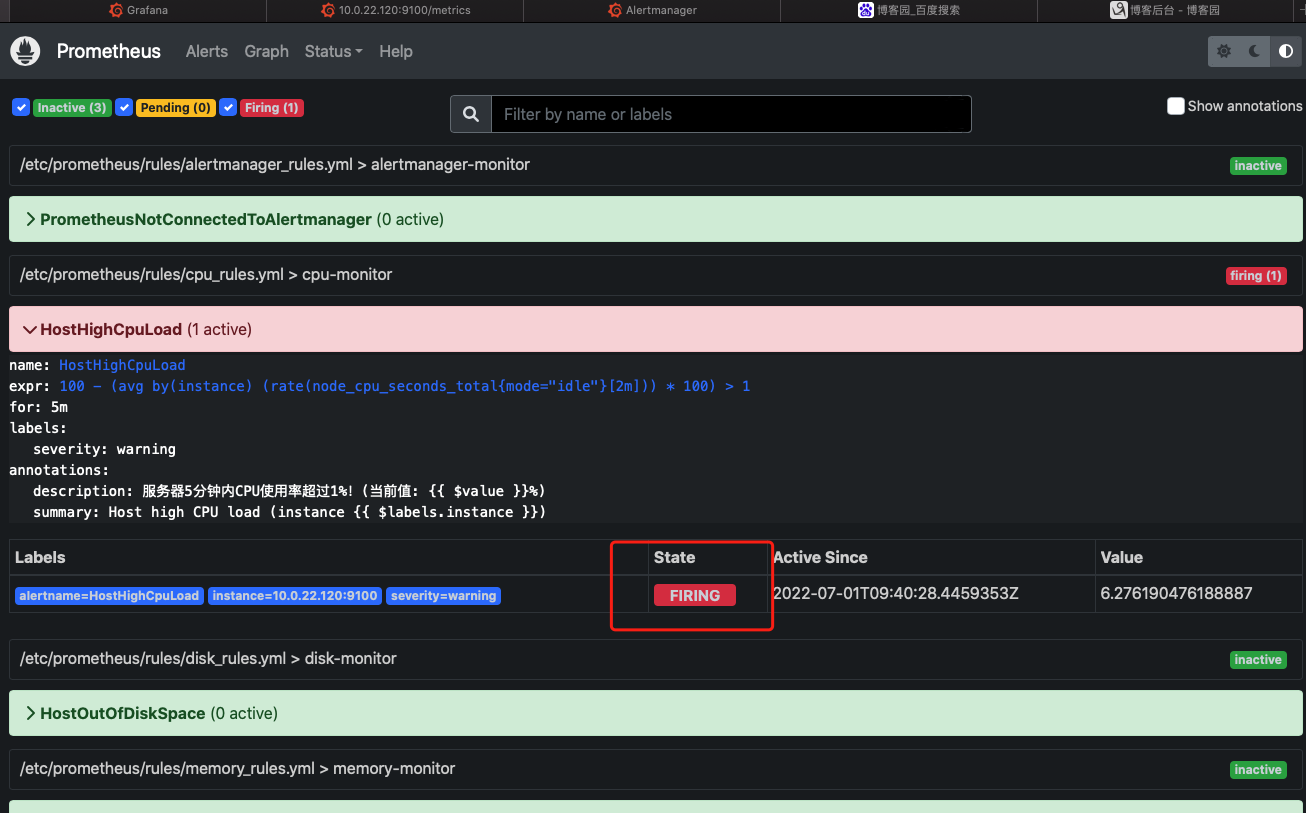
1.2. rules--cpu检测配置
这里为了方便测试,直接超过1%使用率就报警
groups:
  - name: cpu-monitor
    rules:
    - alert: HostHighCpuLoad
      expr: 100 - (avg by(instance) (rate(node_cpu_seconds_total{mode="idle"}[2m])) * 100) > 1
      for: 5m
      labels:
        severity: warning
      annotations:
        summary: Host high CPU load (instance {{ $labels.instance }})
        # description: "CPU load is > 80%\n  VALUE = {{ $value }}\n  LABELS = {{ $labels }}"
        description: "服务器5分钟内CPU使用率超过1%!(当前值: {{ $value }}%)"
2. grafana搭建
监控可视化
2.1. docker-compose配置
记得把./grafana/data的权限设置为777
grafana:
    image: grafana/grafana:6.5.0
    container_name: grafana
    restart: always
    network_mode: default_network
    logging:
        driver: "json-file"
        options:
            max-size: "200m"
            max-file: "10"
    volumes:
      - ./grafana/data:/var/lib/grafana
    ports:
      - "0.0.0.0:3000:3000"
2.2. 配置
使用默认配置
3. node-exporter搭建
用来监控各节点的资源信息的exporter,应部署到prometheus监控的所有节点
3.1. docker-compose配置
node-exporter:
    image: prom/node-exporter:v1.3.1
    container_name: node-exporter
    restart: always
    network_mode: default_network
    logging:
        driver: "json-file"
        options:
            max-size: "200m"
            max-file: "10"
    ports:
      - "0.0.0.0:9100:9100"
3.2. 配置
使用默认配置
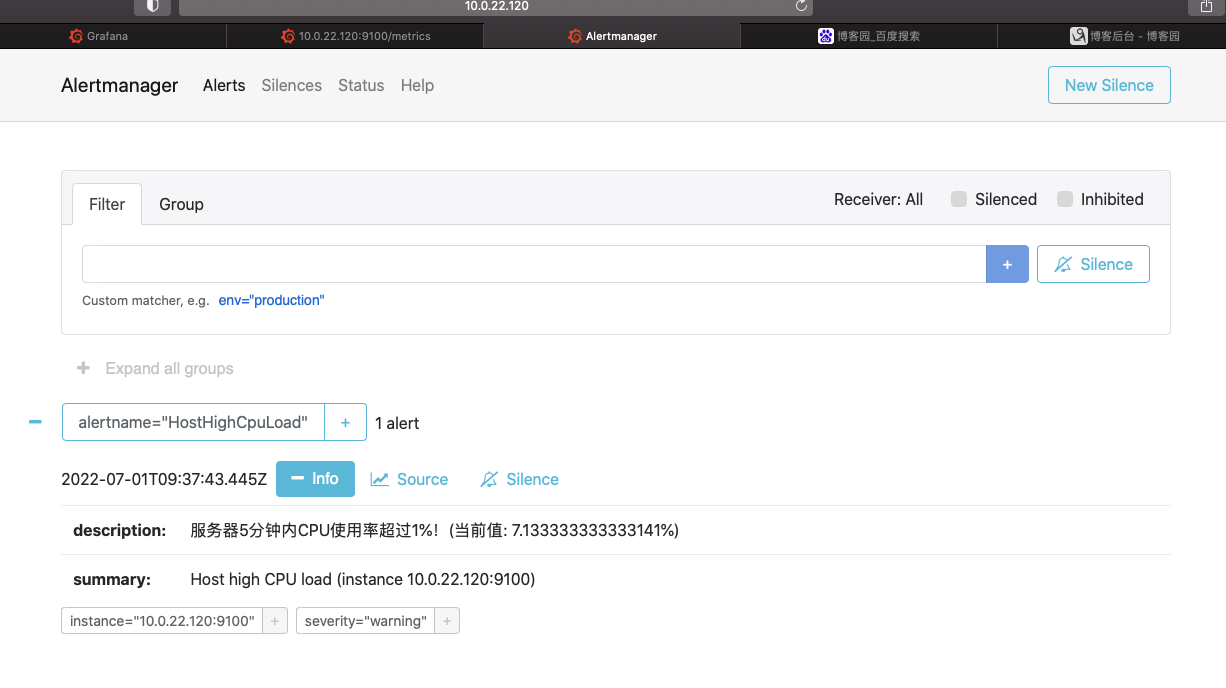
4. alertmanager搭建
处理由客户端应用程序(如Prometheus server)发送的警报。它负责将重复数据删除,分组和路由到正确的接收者集成,还负责沉默和抑制警报
4.1. docker-compose配置
记得把./prometheus/data的权限设置为777
alertmanager:
    image: prom/alertmanager:v0.24.0
    container_name: alertmanager
    restart: always
    network_mode: default_network
    logging:
        driver: "json-file"
        options:
            max-size: "200m"
            max-file: "10"
    volumes:
      - ./alertmanager/alertmanager.yml:/etc/alertmanager/alertmanager.yml
      - ./alertmanager/data:/alertmanager
    ports:
      - "0.0.0.0:9093:9093"
4.2. 配置
配置相关邮件地址
global:
  # The smarthost and SMTP sender used for mail notifications.
  smtp_smarthost: 'smtp.xxxxxxx:25'
  smtp_from: 'xxxxx@163.com'
  smtp_auth_username: 'xxxx@163.com'
  smtp_auth_password: 'xxxxx'
  smtp_require_tls: true
route:
  group_by: ['alertname']
  group_wait: 30s
  group_interval: 5m
  repeat_interval: 1h
  receiver: 'email'
receivers:
  - name: 'email'
    email_configs:
      - to: 'xxxxxx@163.com'
inhibit_rules:
  - source_match:
      severity: 'critical'
    target_match:
      severity: 'warning'
    equal: ['alertname', 'dev', 'instance']
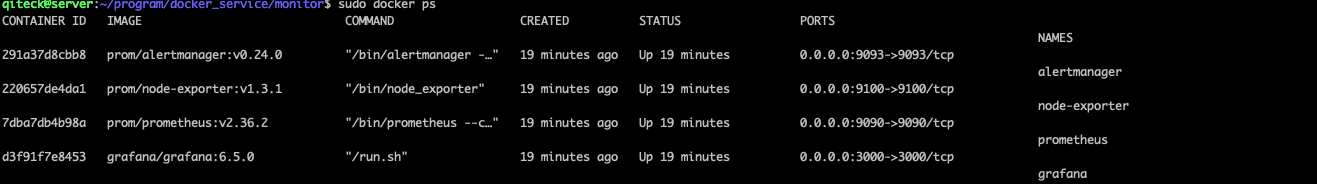
5. docker-compose部署
sudo docker-compose -f docker-compose.yml up -d
查看container:
291a37d8cbb8   prom/alertmanager:v0.24.0         "/bin/alertmanager -…"   19 minutes ago   Up 19 minutes          0.0.0.0:9093->9093/tcp                                                                                                                                                                                                                                                alertmanager
220657de4da1   prom/node-exporter:v1.3.1         "/bin/node_exporter"     19 minutes ago   Up 19 minutes          0.0.0.0:9100->9100/tcp                                                                                                                                                                                                                                                node-exporter
7dba7db4b98a   prom/prometheus:v2.36.2           "/bin/prometheus --c…"   19 minutes ago   Up 19 minutes          0.0.0.0:9090->9090/tcp                                                                                                                                                                                                                                                prometheus
d3f91f7e8453   grafana/grafana:6.5.0             "/run.sh"                19 minutes ago   Up 19 minutes          0.0.0.0:3000->3000/tcp                                                                                                                                                                                                                                                grafana
6. 验证
这样就完成了,测试一下,邮件是否有收到