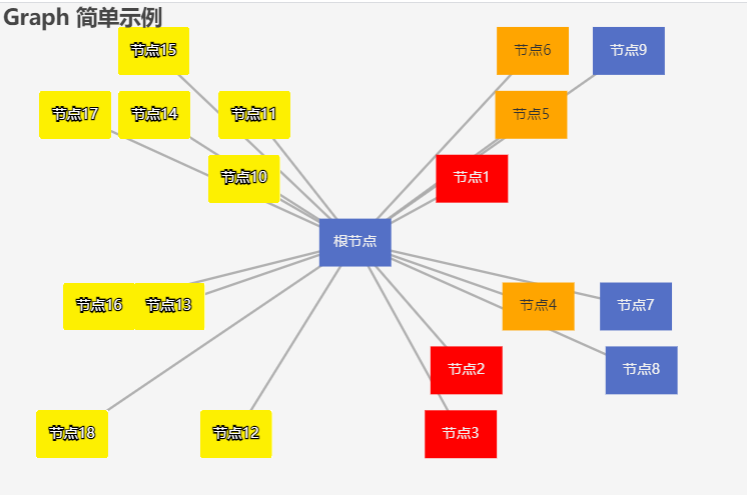
<template>
  <div class="Echarts">
    <div
      id="main"
      style=" 600px;height:400px;"
    />
  </div>
</template>
<script>
import * as echarts from "echarts";
import imgUrl from "@/assets/timg.jpg";

export default {
  name: "Echarts",
  data () {
    return {
      echartData: []
    };
  },
  created () {
    this.echartData = this.getData();
  },
  mounted () {
    this.myEcharts();
  },
  methods: {
    myEcharts () {
      // 基于准备好的dom,初始化echarts实例
      var myChart = echarts.init(document.getElementById("main"));

      // 指定图表的配置项和数据
      var option = {
        title: {
          text: "Graph 简单示例"
        },
        tooltip: {},
        animationDurationUpdate: 1500,
        animationEasingUpdate: "quinticInOut",
        series: [
          {
            type: "graph",
            layout: "none",
            symbolSize: this.setSize,
            symbol: "-",
            roam: true,
            label: {
              show: true
            },
            data: this.getData(),
            links: this.getLinks(),
            lineStyle: {
              opacity: 0.9,
               2,
              curveness: 0
            }
          }
        ]
      };

      // 使用刚指定的配置项和数据显示图表。
      myChart.setOption(option);
    },

    getData () {
      const rArr = []
      const lArr = []
      const r1 = ["节点1", "节点2", "节点3"].map((v, i) => {
        const curtX = this.randomNums(120, 160)
        const curtY = 40 * (i + 1) * 2
        const name = v
        const nowObj = this.checkTwo(curtX, curtY, rArr, name)
        rArr.push(nowObj)
        return {
          x: nowObj.x,
          y: Math.random() * 10 > 5 ? nowObj.y : - nowObj.y,
          name: v,
          itemStyle: {
            color: 'red'
          }
        }
      });
      const l1 = ["节点10", "节点11", "节点12"].map((v, i) => {
        const curtX = this.randomNums(120, 160)
        const curtY = 40 * (i + 1) * 2
        return {
          x: -curtX,
          y: Math.random() * 10 > 5 ? curtY : - curtY,
          name: v,
          symbol: `image://${imgUrl}`,
        }
      });
      const l2 = ["节点13", "节点14", "节点15"].map((v, i) => {
        const curtX = this.randomNums(220, 260)
        const curtY = 40 * (i + 1) * 2
        return {
          x: -curtX,
          y: Math.random() * 10 > 5 ? curtY : - curtY,
          name: v,
          symbol: `image://${imgUrl}`
        }
      });
      const r2 = ["节点4", "节点5", "节点6"].map((v, i) => {
        const curtX = this.randomNums(220, 260)
        const curtY = 40 * (i + 1) * 2
        const name = v
        const nowObj = this.checkTwo(curtX, curtY, rArr, name)
        rArr.push(nowObj)
        return {
          x: nowObj.x,
          y: Math.random() * 10 > 5 ? nowObj.y : - nowObj.y,
          name: v,
          itemStyle: {
            color: 'orange'
          }
        }
      });

      const r3 = ["节点7", "节点8", "节点9"].map((v, i) => {
        const curtX = this.randomNums(320, 360)
        const curtY = 40 * (i + 1) * 2
        return {
          x: curtX,
          y: Math.random() * 10 > 5 ? curtY : - curtY,
          name: v
        }
      });
      const l3 = ["节点16", "节点17", "节点18"].map((v, i) => {
        const curtX = this.randomNums(320, 360)
        const curtY = 40 * (i + 1) * 2
        return {
          x: -curtX,
          y: Math.random() * 10 > 5 ? curtY : - curtY,
          name: v,
          symbol: `image://${imgUrl}`
        }
      });
      const centers = {
        name: "根节点",
        x: 0,
        y: 0
      };
      //   const r2 = [];
      //   const l1 = [];
      //   const l2 = [];
      //   const r3 = [];
      //   const l3 = [];
      const data = [centers, ...r1, ...r2, ...r3, ...l1, ...l2, ...l3].map(
        (v, i) => {
          if (v.name === "根节点") {
            v.id = i;
          }
          v.id = i;
          return v;
        }
      );
      return data;
    },
    randomNums (min, max) {
      return parseInt(Math.random() * (max - min + 1) + min, 10);
    },
    checkTwo (x, y, arr, name) {
      if (arr.length) {
        for (let i = 0; i < arr.length; i += 1) {
          const rect1 = {
            x,
            y,
             60,
            height: 40
          }
          const rect2 = {
            x: arr[i].x,
            y: arr[i].y,
             60,
            height: 40
          }
          const nowStatus = this.isOverlap(rect1, rect2)
          if (nowStatus) {
            rect1.x += 60
            rect1.y += 40
            return this.checkTwo(rect1.x, rect1.y, arr, name)
          }
        }
      }
      return {
        x,
        y,
        name
      }
    },
    getLinks () {
      const links = this.echartData
        .map(v => {
          if (v.id !== 0) {
            return {
              source: 0,
              target: v.id
            };
          }
        })
        .filter(v => v);
      return links;
    },
    setSize (value, data) {
      return [60, 40];
    },
    isOverlap (rect1, rect2) {
      const startX1 = rect1.x - rect1.width / 2,
        startY1 = rect1.y - rect1.height / 2,
        endX1 = startX1 + rect1.width,
        endY1 = startY1 + rect1.height;

      const startX2 = rect2.x - rect2.width / 2,
        startY2 = rect2.y - rect2.height / 2,
        endX2 = startX2 + rect2.width,
        endY2 = startY2 + rect2.height;

      return !(
        endY2 < startY1 ||
        endY1 < startY2 ||
        startX1 > endX2 ||
        startX2 > endX1
      );
    }
  }
};
</script>

<style></style>

