0 setup
配置文件
import pandas as pd
pd.plotting.register_matplotlib_converters()
import matplotlib.pyplot as plt
%matplotlib inline
import seaborn as sns
print("Setup Complete")
check
# Set up code checking
import os
if not os.path.exists("../input/cancer_b.csv"):
    os.symlink("../input/data-for-datavis/cancer_b.csv", "../input/cancer_b.csv")
    os.symlink("../input/data-for-datavis/cancer_m.csv", "../input/cancer_m.csv")
from learntools.core import binder
binder.bind(globals())
from learntools.data_viz_to_coder.ex5 import *
print("Setup Complete")
1 载入数据
# Paths of the files to read
cancer_b_filepath = "../input/cancer_b.csv"
cancer_m_filepath = "../input/cancer_m.csv"

# Fill in the line below to read the (benign) file into a variable cancer_b_data
cancer_b_data = pd.read_csv(cancer_b_filepath,index_col="Id")

# Fill in the line below to read the (malignant) file into a variable cancer_m_data
cancer_m_data = pd.read_csv(cancer_m_filepath,index_col="Id")
step2 review the data
打印出肿瘤数据的前五行 benign
# Print the first five rows of the (benign) data
cancer_b_data.head()
打印出肿瘤数据的前五行 malignant
cancer_m_data.head()
找到数据
# Fill in the line below: In the first five rows of the data for benign tumors, what is the
# largest value for 'Perimeter (mean)'?
max_perim = 87.46

# Fill in the line below: What is the value for 'Radius (mean)' for the tumor with Id 842517?
mean_radius = 20.57
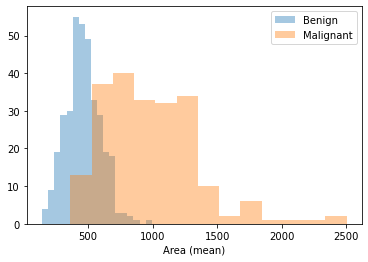
良心肿瘤和恶性肿瘤的直方图
# Histograms for benign and maligant tumors
sns.distplot(a=cancer_b_data['Area (mean)'],label="Benign",kde=False)
sns.distplot(a=cancer_m_data['Area (mean)'],label="Malignant",kde=False)
step_3.a.check()
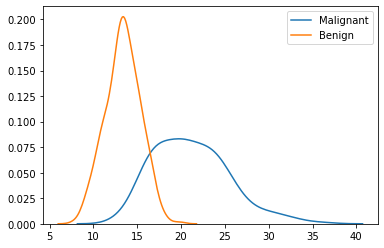
step4 a 曲线图下无阴影
sns.kdeplot(data=cancer_m_data['Radius (worst)'],label="Malignant")
sns.kdeplot(data=cancer_b_data['Radius (worst)'],label="Benign")
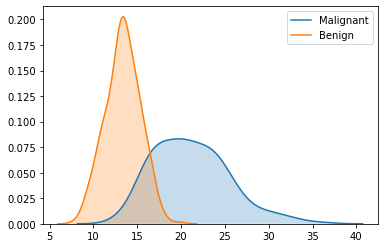
step4 a 曲线图下有阴影
sns.kdeplot(data=cancer_m_data['Radius (worst)'], shade=True, label="Malignant")
sns.kdeplot(data=cancer_b_data['Radius (worst)'], shade=True, label="Benign")
| Diagnosis | Radius (mean) | Texture (mean) | Perimeter (mean) | Area (mean) | Smoothness (mean) | Compactness (mean) | Concavity (mean) | Concave points (mean) | Symmetry (mean) | ... | Radius (worst) | Texture (worst) | Perimeter (worst) | Area (worst) | Smoothness (worst) | Compactness (worst) | Concavity (worst) | Concave points (worst) | Symmetry (worst) | Fractal dimension (worst) | |
|---|---|---|---|---|---|---|---|---|---|---|---|---|---|---|---|---|---|---|---|---|---|
| Id | |||||||||||||||||||||
| 842302 | M | 17.99 | 10.38 | 122.80 | 1001.0 | 0.11840 | 0.27760 | 0.3001 | 0.14710 | 0.2419 | ... | 25.38 | 17.33 | 184.60 | 2019.0 | 0.1622 | 0.6656 | 0.7119 | 0.2654 | 0.4601 | 0.11890 |
| 842517 | M | 20.57 | 17.77 | 132.90 | 1326.0 | 0.08474 | 0.07864 | 0.0869 | 0.07017 | 0.1812 | ... | 24.99 | 23.41 | 158.80 | 1956.0 | 0.1238 | 0.1866 | 0.2416 | 0.1860 | 0.2750 | 0.08902 |
| 84300903 | M | 19.69 | 21.25 | 130.00 | 1203.0 | 0.10960 | 0.15990 | 0.1974 | 0.12790 | 0.2069 | ... | 23.57 | 25.53 | 152.50 | 1709.0 | 0.1444 | 0.4245 | 0.4504 | 0.2430 | 0.3613 | 0.08758 |
| 84348301 | M | 11.42 | 20.38 | 77.58 | 386.1 | 0.14250 | 0.28390 | 0.2414 | 0.10520 | 0.2597 | ... | 14.91 | 26.50 | 98.87 | 567.7 | 0.2098 | 0.8663 | 0.6869 | 0.2575 | 0.6638 | 0.17300 |
| 84358402 | M | 20.29 | 14.34 | 135.10 | 1297.0 | 0.10030 | 0.13280 | 0.1980 | 0.10430 | 0.1809 | ... | 22.54 | 16.67 | 152.20 | 1575.0 | 0.1374 | 0.2050 | 0.4000 | 0.1625 | 0.2364 | 0.07678 |