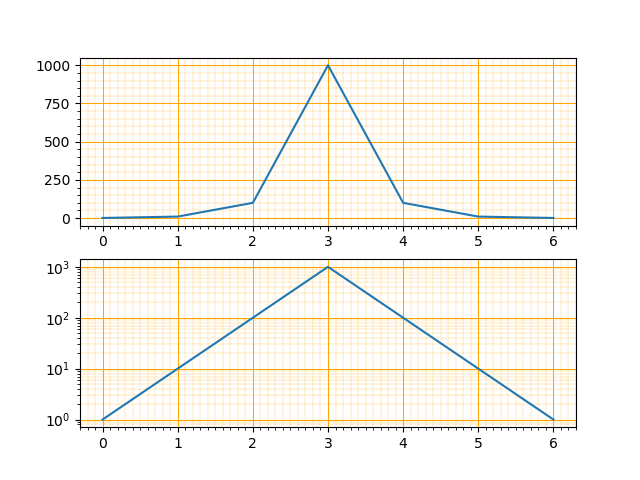
一、半对数坐标系
import matplotlib.pyplot as mp

y = [1, 10, 100, 1000, 100, 10, 1]

mp.figure('Semilogy', facecolor='lightgray')
mp.subplot(211)

ax = mp.gca()
ax.xaxis.set_major_locator(mp.MultipleLocator(1))
ax.xaxis.set_minor_locator(mp.MultipleLocator(0.1))
ax.yaxis.set_major_locator(mp.MultipleLocator(250))
ax.yaxis.set_minor_locator(mp.MultipleLocator(50))

ax.grid(which='major', axis='both', linestyle='-', linewidth=0.75, color='orange')
ax.grid(which='minor', axis='both', linestyle='--', linewidth=0.25, color='orange')
mp.plot(y)

mp.subplot(212)
ax = mp.gca()
ax.xaxis.set_major_locator(mp.MultipleLocator(1))
ax.xaxis.set_minor_locator(mp.MultipleLocator(0.1))
ax.yaxis.set_major_locator(mp.MultipleLocator(250))
ax.yaxis.set_minor_locator(mp.MultipleLocator(50))

ax.grid(which='major', axis='both', linestyle='-', linewidth=0.75, color='orange')
ax.grid(which='minor', axis='both', linestyle='--', linewidth=0.25, color='orange')
mp.semilogy(y)

mp.show()
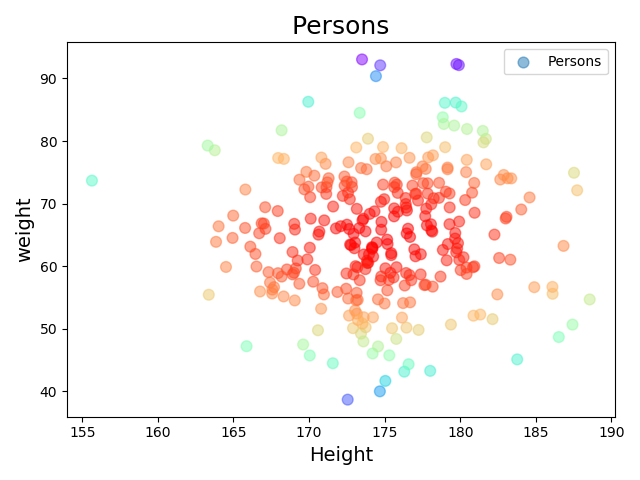
二、散点图
import numpy as np
import matplotlib.pyplot as mp

n = 300
x = np.random.normal(175, 5, n)
y = np.random.normal(65, 10, n)

mp.figure('Persons', facecolor='lightgray')
mp.title('Persons', fontsize=18)
mp.xlabel('Height', fontsize=14)
mp.ylabel('weight', fontsize=14)
d = (x - 175) ** 2 + (y - 65) ** 2  # 数组
mp.scatter(x, y, s=60, alpha=0.5, c=d, cmap='rainbow_r', marker='o', label='Persons')
mp.legend()
mp.tight_layout()
mp.show()
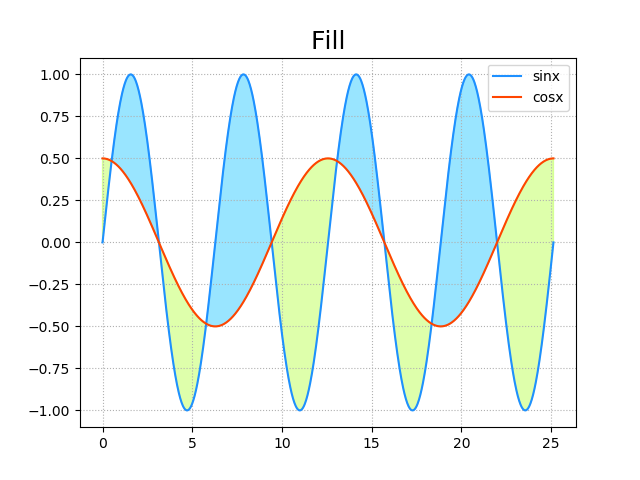
三、填充图
import numpy as np
import matplotlib.pyplot as mp

n = 1000
x = np.linspace(0, 8 * np.pi, n)
sinx = np.sin(x)
cosx = np.cos(x / 2) / 2
mp.figure('Fill', facecolor='lightgray')
mp.title('Fill', fontsize=18)
mp.grid(linestyle=':')
mp.plot(x, sinx, color='dodgerblue', label='sinx')
mp.plot(x, cosx, color='orangered', label='cosx')
mp.fill_between(x, sinx, cosx, sinx > cosx, color='deepskyblue', alpha=0.4)
mp.fill_between(x, sinx, cosx, sinx < cosx, color='greenyellow', alpha=0.4)
mp.fill_between(x, sinx, cosx, sinx == cosx, color='black', alpha=0.4)

mp.legend()
mp.show()
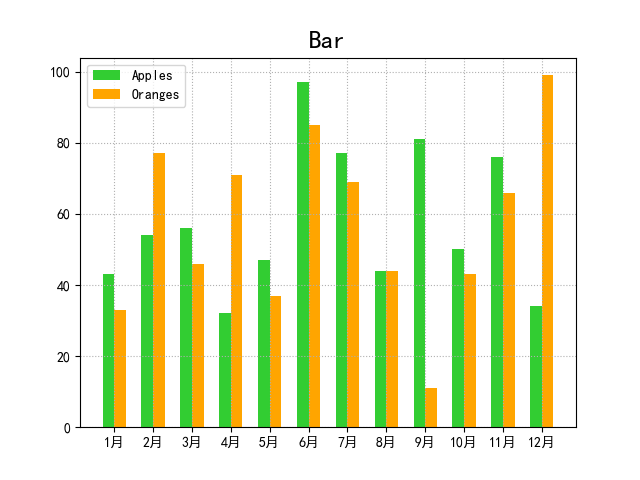
四、条形图、柱状图
import numpy as np
import matplotlib.pyplot as mp

mp.rcParams['font.sans-serif'] = ['SimHei']

x = np.arange(1, 13)
apples = [43, 54, 56, 32, 47, 97, 77, 44, 81, 50, 76, 34]
oranges = [33, 77, 46, 71, 37, 85, 69, 44, 11, 43, 66, 99]

mp.figure('Bar', facecolor='lightgray')
mp.title('Bar', fontsize=18)
mp.grid(linestyle=':')
mp.bar(x - 0.15, apples, width=0.3, bottom=0, color='limegreen', label='Apples')
mp.bar(x + 0.15, oranges, width=0.3, bottom=0, color='orange', label='Oranges')
mp.xticks(x, ['1月', '2月', '3月', '4月', '5月', '6月', '7月', '8月', '9月', '10月', '11月', '12月'])

mp.legend()
mp.show()
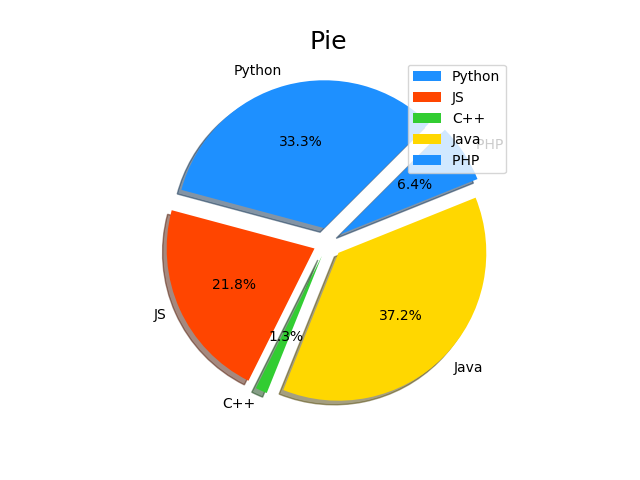
五、饼图
import numpy as np
import matplotlib.pyplot as mp

values = [26, 17, 1, 29, 5]
labels = ['Python', 'JS', 'C++', 'Java', 'PHP ']
spaces = [0.1, 0.1, 0.1, 0.1, 0.1]
colors = ['dodgerblue', 'orangered', 'limegreen', 'gold']

mp.figure('Pie', facecolor='lightgray')
mp.title('Pie', fontsize=18)
# mp.axis('equal')
mp.pie(values, spaces, labels, colors, '%.1f%%', shadow=True, radius=1, startangle=45)

mp.legend(loc=1)
mp.show()
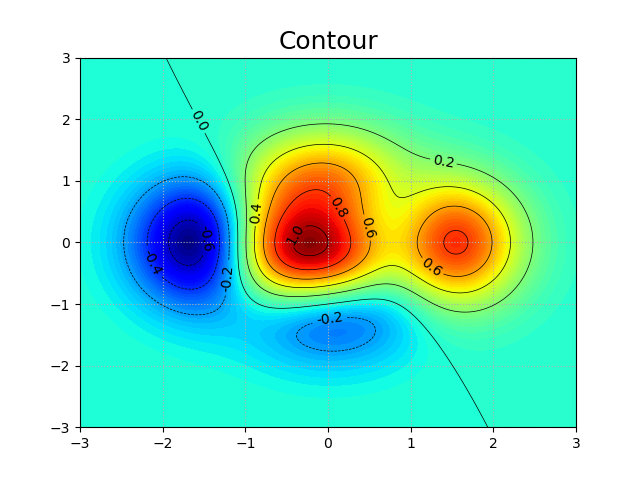
六、等高线图
import numpy as np
import matplotlib.pyplot as mp

n = 1000
x, y = np.meshgrid(np.linspace(-3, 3, n), np.linspace(-3, 3, n))
z = (1 - x / 2 + x ** 5 + y ** 3) * np.exp(-x ** 2 - y ** 2)

mp.figure('Contour', facecolor='lightgray')
mp.title('Contour', fontsize=18)
mp.grid(linestyle=":")
cntr = mp.contour(x, y, z, 8, colors='black', linewidths=0.5)
mp.clabel(cntr, fmt='%.1f', fontsize=10, inline_spacing=1)
mp.contourf(x, y, z, 80, cmap='jet')
mp.show()
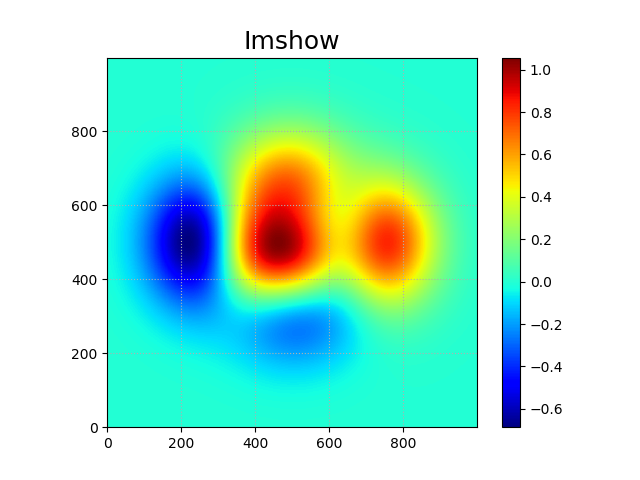
七、热成像图
import numpy as np
import matplotlib.pyplot as mp

n = 1000
x, y = np.meshgrid(np.linspace(-3, 3, n), np.linspace(-3, 3, n))
z = (1 - x / 2 + x ** 5 + y ** 3) * np.exp(-x ** 2 - y ** 2)

mp.figure('Imshow', facecolor='lightgray')
mp.title('Imshow', fontsize=18)
mp.grid(linestyle=":")

mp.imshow(z, cmap='jet', origin='lower')
# 颜色条
mp.colorbar()
mp.show()
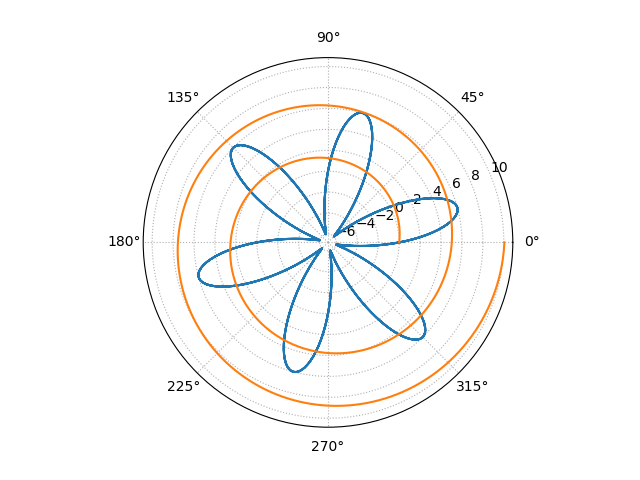
八、极坐标系
import matplotlib.pyplot as mp
import numpy as np

mp.figure('Polar', facecolor='lightgray')
mp.title('Polar', fontsize=18)
mp.gca(projection='polar')
mp.grid(linestyle=':')
t = np.linspace(0, 4 * np.pi, 1000)
r = 0.8 * t
x = np.linspace(0, 6 * np.pi, 1000)
y = 6 * np.sin(6 * x)
mp.plot(x, y)
mp.plot(t, r)
mp.show()