由于项目需要, 需要对网页的一些性能进行监控, 接触到了performance,
window.performance 提供了一组精确的数据,经过简单的计算就能得出一些网页性能数据, 将这些数据存储为日志, 可有效的对网页性能进行监控.
首先看一下在Chrome 的控制台执行window.performance会出现什么
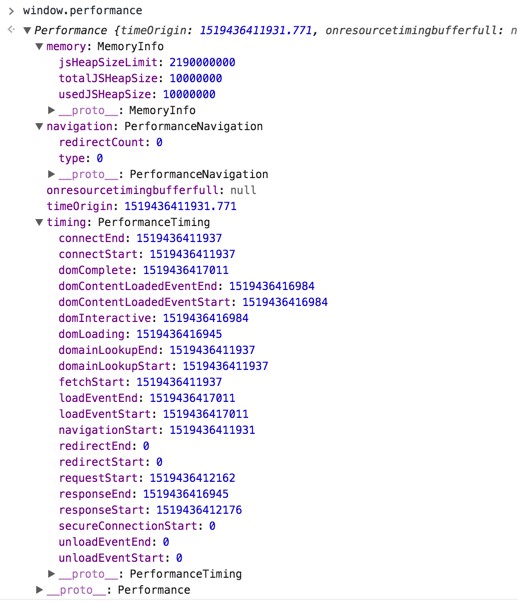
下面是对这些属性的详细解释:
 1 performance = {
 2     // memory 是非标准属性,只在 Chrome 有
 3     //这个属性提供了一个可以获取到基本内存使用情况的对象
 4     memory: {
 5         usedJSHeapSize:  10000000, // JS 对象(包括V8引擎内部对象)占用的内存
 6         totalJSHeapSize: 10000000, // 可使用的内存
 7         jsHeapSizeLimit: 2190000000 // 内存大小限制
 8     },
 9
10     //  navigation: 提供操作(包含在 timing 里时间)的有用上下文
11     //包括页面是加载还是刷新、发生了多少次重定向,等等。
12     navigation: {
13         redirectCount: 0, // 重定向次数
14         type: 0           // 0   正常进入的页面(即非刷新、非重定向等)
15                           // 1   通过 window.location.reload() (即刷新页面)
16                           // 2   通过浏览器的前进后退按钮进入的页面(历史记录)
17                           // 255 非以上方式进入的页面
18     },
19
20     timing: {
21         // 同一个浏览器上下文的上一个文档卸载(unload)结束时的UNIX时间戳。
22        //如果没有上一个文档,这个值会和fetchStart相同。
23         navigationStart: 1441112691935,
24
25         // 上一个文档unload事件抛出时的UNIX时间戳。
26         //如果没有上一个文档,这个值会返回0.
27         unloadEventStart: 0,
28
29         // 和 unloadEventStart 相对应,unload事件处理完成时的UNIX时间戳。
30         //如果没有上一个文档,这个值会返回0.
31         unloadEventEnd: 0,
32
33         // 第一个HTTP重定向开始时的UNIX时间戳。
34         //如果没有重定向,或者重定向中的一个不同源,这个值会返回0.
35         redirectStart: 0,
36
37         // 最后一个HTTP重定向完成时(也就是说是HTTP响应的最后一个比特直接被收到的时间)的UNIX时间戳。
38         //如果没有重定向,或者重定向中的一个不同源,这个值会返回0.
39         redirectEnd: 0,
40
41         // 浏览器准备好使用HTTP请求来获取(fetch)文档的UNIX时间戳。这个时间点会在检查任何应用缓存之前。
42         fetchStart: 1441112692155,
43
44         // DNS 域名查询开始的UNIX时间戳。
45        //如果使用了持续连接(persistent connection),或者这个信息存储到了缓存或者本地资源上,这个值将和fetchStart一致。
46         domainLookupStart: 1441112692155,
47
48         // DNS 域名查询完成的时间.
49         //如果使用了本地缓存(即无 DNS 查询)或持久连接,则与 fetchStart 值相等
50         domainLookupEnd: 1441112692155,
51
52         // HTTP(TCP) 域名查询结束的UNIX时间戳。
53        //如果使用了持续连接(persistent connection),或者这个信息存储到了缓存或者本地资源上,这个值将和 fetchStart一致。
54         connectStart: 1441112692155,
55
56         // HTTP(TCP) 返回浏览器与服务器之间的连接建立时的Unix毫秒时间戳。
57        // 如果建立的是持久连接,则返回值等同于fetchStart属性的值。
58        //连接建立指的是所有握手和认证过程全部结束。
59         connectEnd: 1441112692155,
60
61         // HTTPS 返回浏览器与服务器开始安全链接的握手时的Unix毫秒时间戳。
62        //如果当前网页不要求安全连接,则返回0。
63         secureConnectionStart: 0,
64
65         // 返回浏览器向服务器发出HTTP请求时(或开始读取本地缓存时)的Unix毫秒时间戳。
66         requestStart: 1441112692158,
67
68         // 返回浏览器从服务器收到(或从本地缓存读取)第一个字节时的Unix毫秒时间戳。
69        //如果传输层在开始请求之后失败并且连接被重开,该属性将会被数制成新的请求的相对应的发起时间。
70         responseStart: 1441112692686,
71
72         // 返回浏览器从服务器收到(或从本地缓存读取,或从本地资源读取)最后一个字节时(如果在此之前HTTP连接已经关闭,则返回关闭时)的Unix毫秒时间戳。
73         responseEnd: 1441112692687,
74
75         // 当前网页DOM结构开始解析时(即Document.readyState属性变为“loading”、相应的 readystatechange事件触发时)的Unix毫秒时间戳。
76         domLoading: 1441112692690,
77
78         // 当前网页DOM结构结束解析、开始加载内嵌资源时(即Document.readyState属性变为“interactive”、相应的readystatechange事件触发时)的Unix毫秒时间戳。
79         domInteractive: 1441112693093,
80
81         // 当解析器发送DOMContentLoaded 事件,即所有需要被执行的脚本已经被解析时的Unix毫秒时间戳。
82         domContentLoadedEventStart: 1441112693093,
83
84         // 当所有需要立即执行的脚本已经被执行(不论执行顺序)时的Unix毫秒时间戳。
85         domContentLoadedEventEnd: 1441112693101,
86
87         // 当前文档解析完成,即Document.readyState 变为 'complete'且相对应的readystatechange 被触发时的Unix毫秒时间戳
88         domComplete: 1441112693214,
89
90         // load事件被发送时的Unix毫秒时间戳。如果这个事件还未被发送,它的值将会是0。
91
92         loadEventStart: 1441112693214,
93
94         // 当load事件结束,即加载事件完成时的Unix毫秒时间戳。如果这个事件还未被发送,或者尚未完成,它的值将会是0.
95         loadEventEnd: 1441112693215
96     }
97 };
通过这些属性, 能够计算出一些重要的网页性能数据:
// 计算加载时间
function getPerformanceTiming () {
    var performance = window.performance;

    if (!performance) {
        // 当前浏览器不支持
        return;
    }

    var t = performance.timing;
    var times = {};

    //页面加载完成的时间
    times.loadPage = t.loadEventEnd - t.navigationStart;

    //【重要】解析 DOM 树结构的时间
    times.domReady = t.domComplete - t.responseEnd;

    //【重要】重定向的时间
    times.redirect = t.redirectEnd - t.redirectStart;

    //【重要】DNS 查询时间
    times.lookupDomain = t.domainLookupEnd - t.domainLookupStart;

    //【重要】读取页面第一个字节的时间
    // TTFB 即 Time To First Byte
    times.ttfb = t.responseStart - t.navigationStart;

    //【重要】内容加载完成的时间
    times.request = t.responseEnd - t.requestStart;

    //【重要】执行 onload 回调函数的时间
    //【原因】是否太多不必要的操作都放到 onload 回调函数里执行了,考虑过延迟加载、按需加载的策略么?
    times.loadEvent = t.loadEventEnd - t.loadEventStart;

    // DNS 缓存时间
    times.appcache = t.domainLookupStart - t.fetchStart;

    // 卸载页面的时间
    times.unloadEvent = t.unloadEventEnd - t.unloadEventStart;

    // TCP 建立连接完成握手的时间
    times.connect = t.connectEnd - t.connectStart;

    return times;
}
Performance还提供了一些方法供使用
Performance.now()
返回一个 时间戳,表示从参考时刻开始经过的毫秒量
该时间戳的值是从 window.performance.timing 接口的navigationStart属性中的时间戳值为起始点开始计时的.
和JavaScript中其他可用的时间类函数(比如Date.now)不同的是,window.performance.now()返回的时间戳没有被限制在一毫秒的精确度内,而它使用了一个浮点数来达到微秒级别的精确度.
另外一个不同点是,window.performance.now()是以一个恒定的速率慢慢增加的,它不会受到系统时间的影响(可能被其他软件调整)
使用示例:
let t0 = window.performance.now();
doSomething();
let t1 = window.performance.now();
console.log("doSomething函数执行了" + (t1 - t0) + "毫秒.")
Performance.mark()
在浏览器的性能输入缓冲区中创建一个 timestamp,基于给定的 name
示例:
function create_mark(name) {
if (performance.mark === undefined) {
console.log("performance.mark Not supported");
return;
}
// Create the performance mark
performance.mark(name);
// mark 方法是可以创建多条同名 performanceEntry 的,例如:
// performance.mark("begin")
// performance.mark("begin")
// performance.mark("begin")
// performance.mark("begin")
// performance.getEntriesByName("begin")
// [...]
// 0: PerformanceMark { name: "begin", entryType: "mark", startTime: 94661370.14, … }
// 1: PerformanceMark { name: "begin", entryType: "mark", startTime: 95542853.4, … }
// 2: PerformanceMark { name: "begin", entryType: "mark", startTime: 95545560.92, … }
// 3: PerformanceMark { name: "begin", entryType: "mark", startTime: 95548089.94, … }
// length: 4
// __proto__: Array []
}
Performance.clearMarks()
移除给定的 mark,从浏览器的性能输入缓冲区中
下面的例子演示clearMarks() 的两种用法。
function clear_mark(name) {
if (performance.clearMarks === undefined) {
console.log("performance.clearMarks Not supported");
return;
}
//移除所有标记了此名称的peformance entry
performance.clearMarks(name);
}
function clear_all_marks() {
if (performance.clearMarks === undefined) {
console.log("performance.clearMarks Not supported");
return;
}
//从performance 缓冲区中移除所有标记的performance entry
performance.clearMarks();
}
Performance.clearMeasures()
移除给定的 measure,从浏览器的性能输入缓冲区中
Performance.clearResourceTimings()
移除所有的 entryType 是 "resource" 的 performance entries,从浏览器的性能数据缓冲区中
Performance.getEntries()
返回一个 PerformanceEntry 对象的列表,基于给定的 filter
Performance.getEntriesByName()
返回一个 PerformanceEntry 对象的列表,基于给定的 name 和 entry type
Performance.getEntriesByType()
返回一个 PerformanceEntry 对象的列表,基于给定的 entry type
Performance.measure()
在浏览器的指定 start mark 和 end mark 间的性能输入缓冲区中创建一个指定的 timestamp
Performance.setResourceTimingBufferSize()
将浏览器的资源 timing 缓冲区的大小设置为 "resource" type performance entry 对象的指定数量
Performance.toJSON()
是一个 JSON 格式转化器,返回 Performance 对象的 JSON 对象
使用performance的这些属性和方法, 能够准确的记录下我们想要的时间, 再加上日志采集等功能的辅助,我们就能很容易的掌握自己网站的各项性能指标了.