作者简介:
赵君|南京爱福路汽车科技有限公司基础设施部云原生工程师,过去一直从事 java 相关的架构和研发工作。目前主要负责公司的云原生落地相关工作,负责 F6 基础设施和业务核心应用全面上云和云原生化改造。
徐航|南京爱福路汽车科技有限公司基础设施部云原生工程师,过去一直负责数据库高可用以及相关运维和调优工作。目前主要负责研发效能 DevOps 的落地以及业务系统云原生可观测性的改造。
随着分布式架构逐渐成为了架构设计的主流,可观测性(Observability)一词也日益被人频繁地提起。
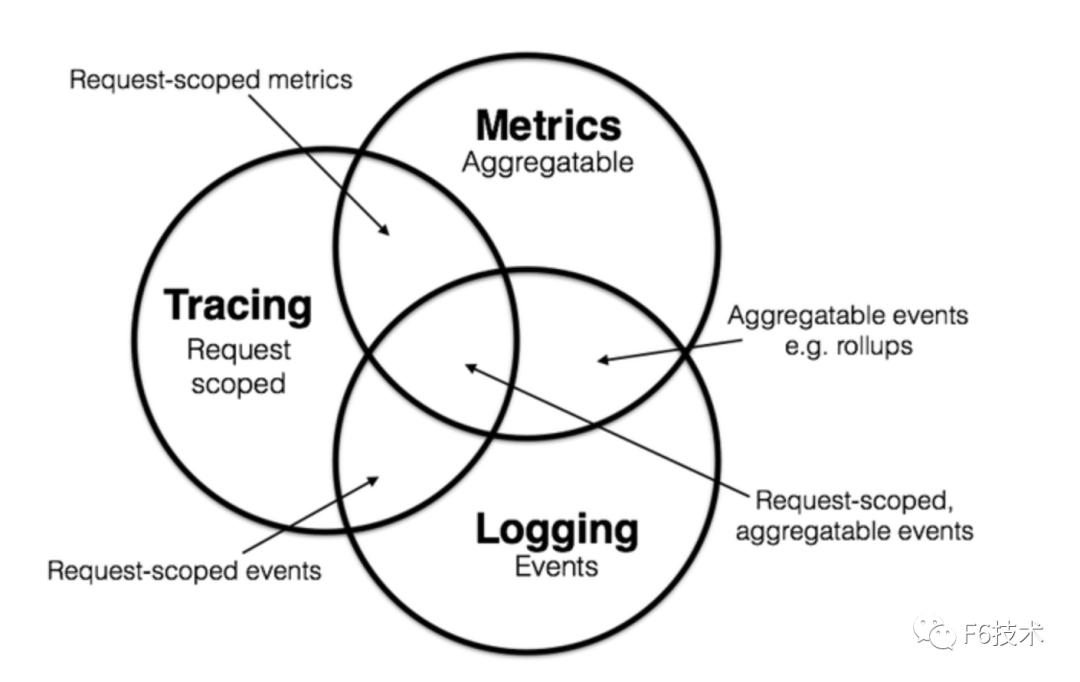
2017 年的分布式追踪峰会(2017 Distributed Tracing Summit)结束后,Peter Bourgon 撰写了总结文章《Metrics, Tracing, and Logging》系统地阐述了这三者的定义、特征,以及它们之间的关系与差异。文中将可观测性问题映射到了如何处理指标(metrics)、追踪(tracing)、日志(logging)三类数据上。
其后,Cindy Sridharan 在其著作《Distributed Systems Observability》中,进一步讲到指标、追踪、日志是可观测性的三大支柱(three pillars)。
到了 2018 年, CNCF Landscape 率先出现了 Observability 的概念,将可观测性( Observability )从控制论( Cybernetics )中引入到 IT 领域。在控制论中,可观测性是指系统可以由其外部输出,来推断其内部状态的程度,系统的可观察性越强,我们对系统的可控制性就越强。
可观测性可以解决什么问题?Google SRE Book 第十二章给出了简洁明快的答案:快速排障。
There are many ways to simplify and speed troubleshooting. Perhaps the most fundamental are:
- Building observability—with both white-box metrics and structured logs—into each component from the ground up
- Designing systems with well-understood and observable interfaces between components.
Google SRE Book, Chapter 12
而在云原生时代,分布式系统越来越复杂,分布式系统的变更是非常频繁的,每次变更都可能导致新类型的故障。应用上线之后,如果缺少有效的监控,很可能导致遇到问题我们自己都不知道,需要依靠用户反馈才知道应用出了问题。
本文主要讲述如何建立应用业务指标Metrics监控和如何实现精准告警。Metrics 可以翻译为度量或者指标,指的是对于一些关键信息以可聚合的、数值的形式做定期统计,并绘制出各种趋势图表。透过它,我们可以观察系统的状态与趋势。
技术栈选择
我们的应用都是 Spring Boot 应用,并且使用 Spring Boot Actuator 实现应用的健康检查。从 Spring Boot 2.0 开始,Actuator 将底层改为 Micrometer,提供了更强、更灵活的监测能力。Micrometer 支持对接各种监控系统,包括 Prometheus。
所以我们选择 Micrometer 收集业务指标,Prometheus 进行指标的存储和查询,通过 Grafana 进行展示,通过阿里云的告警中心实现精准告警。
指标收集
对于整个研发部门来说,应该聚焦在能够实时体现公司业务状态的最核心的指标上。例如 Amazon 和 eBay 会跟踪销售量, Google 和 Facebook 会跟踪广告曝光次数等与收入直接相关的实时指标。
Prometheus 默认采用一种名为 OpenMetrics 的指标协议。OpenMetrics 是一种基于文本的格式。下面是一个基于 OpenMetrics 格式的指标表示格式样例。
# HELP http_requests_total The total number of HTTP requests.
# TYPE http_requests_total counter
http_requests_total{method="post",code="200"} 1027
http_requests_total{method="post",code="400"}    3

# Escaping in label values:
msdos_file_access_time_seconds{path="C:\\DIR\\FILE.TXT",error="Cannot find file:\n\"FILE.TXT\""} 1.458255915e9

# Minimalistic line:
metric_without_timestamp_and_labels 12.47

# A weird metric from before the epoch:
something_weird{problem="division by zero"} +Inf -3982045

# A histogram, which has a pretty complex representation in the text format:
# HELP http_request_duration_seconds A histogram of the request duration.
# TYPE http_request_duration_seconds histogram
http_request_duration_seconds_bucket{le="0.05"} 24054
http_request_duration_seconds_bucket{le="0.1"} 33444
http_request_duration_seconds_bucket{le="0.2"} 100392
http_request_duration_seconds_bucket{le="0.5"} 129389
http_request_duration_seconds_bucket{le="1"} 133988
http_request_duration_seconds_bucket{le="+Inf"} 144320
http_request_duration_seconds_sum 53423
http_request_duration_seconds_count 144320

# Finally a summary, which has a complex representation, too:
# HELP rpc_duration_seconds A summary of the RPC duration in seconds.
# TYPE rpc_duration_seconds summary
rpc_duration_seconds{quantile="0.01"} 3102
rpc_duration_seconds{quantile="0.05"} 3272
rpc_duration_seconds{quantile="0.5"} 4773
rpc_duration_seconds{quantile="0.9"} 9001
rpc_duration_seconds{quantile="0.99"} 76656
rpc_duration_seconds_sum 1.7560473e+07
rpc_duration_seconds_count 2693
指标的数据由指标名(metric_name),一组 key/value 标签(label_name=label_value),数字类型的指标值(value),时间戳组成。
metric_name [
  "{" label_name "=" `"` label_value `"` { "," label_name "=" `"` label_value `"` } [ "," ] "}"
] value [ timestamp ]
Meter
Micrometer 提供了多种度量类库(Meter),Meter 是指一组用于收集应用中的度量数据的接口。Micrometer 中,Meter 的具体类型包括:Timer, Counter, Gauge, DistributionSummary, LongTaskTimer, FunctionCounter, FunctionTimer, and TimeGauge
- Counter 用来描述一个单调递增的变量,如某个方法的调用次数,缓存命中/访问总次数等。支持配置 recordFailuresOnly,即只记录方法调用失败的次数。Counter 的指标数据,默认有四个 label:class, method, exception, result。
- Timer 会同时记录 totalcount, sumtime, maxtime 三种数据,有一个默认的 label: exception。
- Gauge 用来描述在一个范围内持续波动的变量。Gauge 通常用于变动的测量值,比如队列中的消息数量,线程池任务队列数等。
- DistributionSummary 用于统计数据分布。
应用接入流程
为了方便微服务应用接入,我们封装了 micrometer-spring-boot-starter。micrometer-spring-boot-starter 的具体实现如下。
1.引入 Spring Boot Actuator 依赖
<dependency>
  <groupId>org.springframework.boot</groupId>
  <artifactId>spring-boot-starter-actuator</artifactId>
</dependency>

<dependency>
  <groupId>io.micrometer</groupId>
  <artifactId>micrometer-registry-prometheus</artifactId>
  <version>${micrometer.version}</version>
</dependency>
2.进行初始配置
Actuator 默认开启了一些指标的收集,比如 system, jvm, http,可以通过配置关闭它们。其实仅仅是我们需要关闭,因为我们已经接了 jmx exporter 了。
management.metrics.enable.jvm=false
management.metrics.enable.process=false
management.metrics.enable.system=false
如果不希望 Web 应用的 Actuator 管理端口和应用端口重合的话,可以使用 management.server.port 设置独立的端口。这是好的实践,可以看到黑客针对 actuator 的攻击,但是换了端口号,不暴露公网问题会少很多。
1management.server.port=xxxx
3.配置 spring bean
TimedAspect 的 Tags.empty() 是故意的,防止产生太长的 class 名称对 prometheus 造成压力。
@PropertySource(value = {"classpath:/micrometer.properties"})
@Configuration
public class MetricsConfig {

    @Bean
    public TimedAspect timedAspect(MeterRegistry registry) {
        return new TimedAspect(registry, (pjp) -> Tags.empty());
    }

    @Bean
    public CountedAspect countedAspect(MeterRegistry registry) {
        return new CountedAspect(registry);
    }

    @Bean
    public PrometheusMetricScrapeEndpoint prometheusMetricScrapeEndpoint(CollectorRegistry collectorRegistry) {
        return new PrometheusMetricScrapeEndpoint(collectorRegistry);
    }

    @Bean
    public PrometheusMetricScrapeMvcEndpoint prometheusMvcEndpoint(PrometheusMetricScrapeEndpoint delegate) {
        return new PrometheusMetricScrapeMvcEndpoint(delegate);
    }

}
应用接入时,引入 micrometer-spring-boot-starter 依赖
<dependency>
  <groupId>xxx</groupId>
  <artifactId>micrometer-spring-boot-starter</artifactId>
</dependency>
现在,就可以通过访问 http://ip:port/actuator/prometheus,来查看 Micrometer 记录的数据。
自定义业务指标
Micrometer 内置了 Counted 和 Timed 两个 annotation。可以通过在对应的方法上加上 @Timed 和 @Counted 注解,来收集方法的调用次数,时间和是否发生异常等信息。
@Timed
如果想要记录打印方法的调用次数和时间,需要给 print 方法加上 @Timed 注解,并给指标定义一个名称。
@Timed(value = "biz.print", percentiles = {0.95, 0.99}, description = "metrics of print")
public String print(PrintData printData) {

}
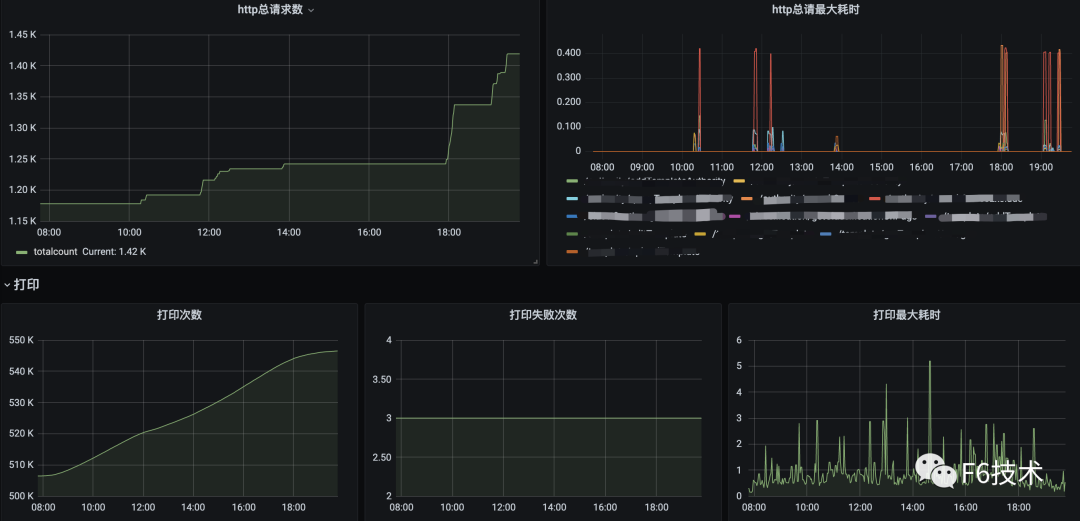
在 print 方法上加上 @Timed 注解之后,Micrometer 会记录 print 方法的调用次数(count),方法调用最大耗时(max),方法调用总耗时(sum)三个指标。percentiles = {0.95, 0.99} 表示计算 p95,p99 的请求时间。记录的指标数据如下。
biz_print_seconds_count{exception="none"} 4.0
biz_print_seconds_sum{exception="none"} 7.783213927
biz_print_seconds_max{exception="none"} 6.14639717
biz_print_seconds{exception="NullPointerException"} 0.318767104
biz_print_seconds{exception="none",quantile="0.95",} 0.58720256
biz_print_seconds{exception="none",quantile="0.99",} 6.157238272
@Timed 注解支持配置一些属性:
- value:必填,指标名
- extraTags:给指标定义标签,支持多个,格式 {"key", "value", "key", "value"}
- percentiles:小于等于 1 的数,计算时间的百分比分布,比如 p95,p99
- histogram:记录方法耗时的 histogram 直方图类型指标
@Timed 会记录方法抛出的异常。不同的异常会被记录为独立的数据。代码逻辑是先 catch 方法抛出的异常,记录下异常名称,然后再抛出方法本身的异常:
try {
    return pjp.proceed();
} catch (Exception ex) {
    exceptionClass = ex.getClass().getSimpleName();
    throw ex;
} finally {
    try {
        sample.stop(Timer.builder(metricName)
                    .description(timed.description().isEmpty() ? null : timed.description())
                    .tags(timed.extraTags())
                    .tags(EXCEPTION_TAG, exceptionClass)
                    .tags(tagsBasedOnJoinPoint.apply(pjp))
                    .publishPercentileHistogram(timed.histogram())
                    .publishPercentiles(timed.percentiles().length == 0 ? null : timed.percentiles())
                    .register(registry));
    } catch (Exception e) {
        // ignoring on purpose
    }
}
@Counted
如果不关心方法执行的时间,只关心方法调用的次数,甚至只关心方法调用发生异常的次数,使用 @Counted 注解是更好的选择。recordFailuresOnly = true 表示只记录异常的方法调用次数。
@Timed(value = "biz.print", recordFailuresOnly = true, description = "metrics of print")
public String print(PrintData printData) {

}
记录的指标数据如下。
biz_print_failure_total{class="com.xxx.print.service.impl.PrintServiceImpl",exception="NullPointerException",method="print",result="failure",} 4.0
counter 是一个递增的数值,每次方法调用后,会自增 1。
private void record(ProceedingJoinPoint pjp, Counted counted, String exception, String result) {
    counter(pjp, counted)
            .tag(EXCEPTION_TAG, exception)
            .tag(RESULT_TAG, result)
            .register(meterRegistry)
            .increment();
}

private Counter.Builder counter(ProceedingJoinPoint pjp, Counted counted) {
    Counter.Builder builder = Counter.builder(counted.value()).tags(tagsBasedOnJoinPoint.apply(pjp));
    String description = counted.description();
    if (!description.isEmpty()) {
        builder.description(description);
    }
    return builder;
}
Gauge
Gauge 用来描述在一个范围内持续波动的变量。Gauge 通常用于变动的测量值,例如雪花算法的 workId,打印的模板 id,线程池任务队列数等。
- 注入 PrometheusMeterRegistry
- 构造 Gauge。给指标命名并赋值。
@Autowired
private PrometheusMeterRegistry meterRegistry;

public void buildGauge(Long workId) {
    Gauge.builder("biz.alphard.snowFlakeIdGenerator.workId", workId, Long::longValue)
            .description("alphard snowFlakeIdGenerator workId")
            .tag("workId", workId.toString())
            .register(meterRegistry).measure();
}
记录的指标数据如下。
biz_alphard_snowFlakeIdGenerator_workId{workId="2"} 2
配置 SLA 指标
如果想要记录指标时间数据的 sla 分布,Micrometer 提供了对应的配置:
management.metrics.distribution.sla[biz.print]=300ms,400ms,500ms,1s,10s
记录的指标数据如下。
biz_print_seconds_bucket{exception="none",le="0.3",} 1.0
biz_print_seconds_bucket{exception="none",le="0.4",} 3.0
biz_print_seconds_bucket{exception="none",le="0.5",} 10.0
biz_print_seconds_bucket{exception="none",le="0.6",} 11.0
biz_print_seconds_bucket{exception="none",le="1.0",} 11.0
biz_print_seconds_bucket{exception="none",le="10.0",} 12.0
biz_print_seconds_bucket{exception="none",le="+Inf",} 12.0
存储查询
我们使用 Prometheus 进行指标数据的存储和查询。Prometheus 采用拉取式采集(Pull-Based Metrics Collection)。Pull 就是 Prometheus 主动从目标系统中拉取指标,相对地,Push 就是由目标系统主动推送指标。Prometheus 官方解释选择 Pull 的原因。
Pulling over HTTP offers a number of advantages:
- You can run your monitoring on your laptop when developing changes.
- You can more easily tell if a target is down.
- You can manually go to a target and inspect its health with a web browser.
Prometheus 也支持 Push 的采集方式,就是 Pushgateway。
For cases where you must push, we offer the Pushgateway.
为了让 Prometheus 采集应用的指标数据,我们需要做两件事:
1.应用通过 service 暴露出 actuator 端口,并添加 label: monitor/metrics
apiVersion: v1
kind: Service
metadata:
  name: print-svc
  labels:
    monitor/metrics: ""
spec:
  ports:
  - name: custom-metrics
    port: xxxx
    targetPort: xxxx
    protocol: TCP
  type: ClusterIP
  selector:
    app: print-test
2.添加 ServiceMonitor
apiVersion: monitoring.coreos.com/v1
kind: ServiceMonitor
metadata:
  name: metrics
  labels:
    app: metric-monitor
spec:
  namespaceSelector:
    any: true
  endpoints:
  - interval: 15s
    port: custom-metrics
    path: "/manage/prometheusMetric"
  selector:
    matchLabels:
      monitor/metrics: ""
Prometheus 会定时访问 service 的 endpoints (http://podip:port/manage/prometheusMetric),拉取应用的 metrics,保存到自己的时序数据库。
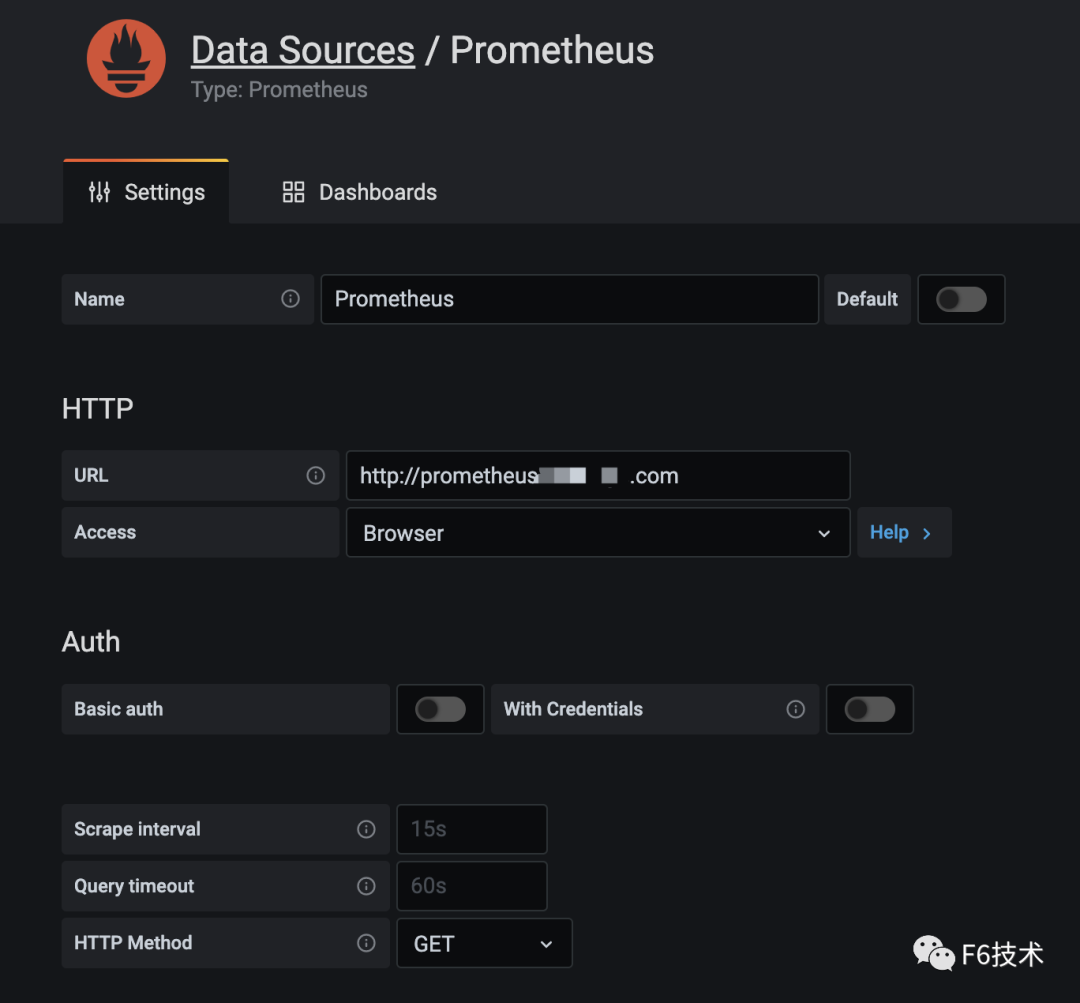
Prometheus 存储的数据是文本格式,虽然 Prometheus 也有 Graph,但是不够炫酷,而且功能有限。还需要有一些可视化工具去展示数据,通过标准易用的可视化大盘去获知当前系统的运行状态。比较常见的解决方案就是 Grafana。Prometheus 内置了强大的时序数据库,并提供了 PromQL 的数据查询语言,能对时序数据进行丰富的查询、聚合以及逻辑运算。通过在 Grafana 配置 Prometheus 数据源和 PromQL,让 Grafana 去查询 Prometheus 的指标数据,以图表的形式展示出来。
1. grafana 配置 Prometheus 数据源
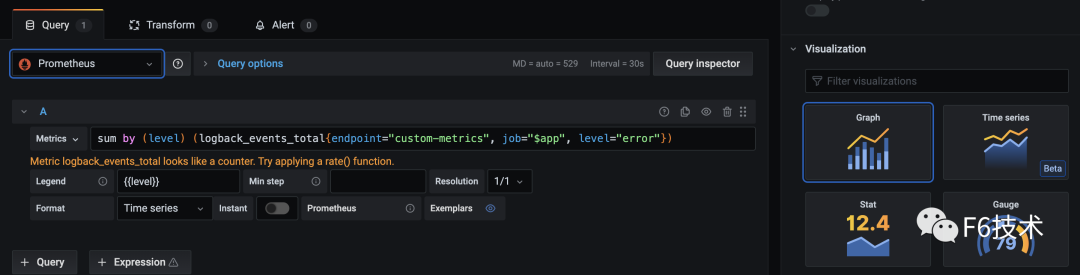
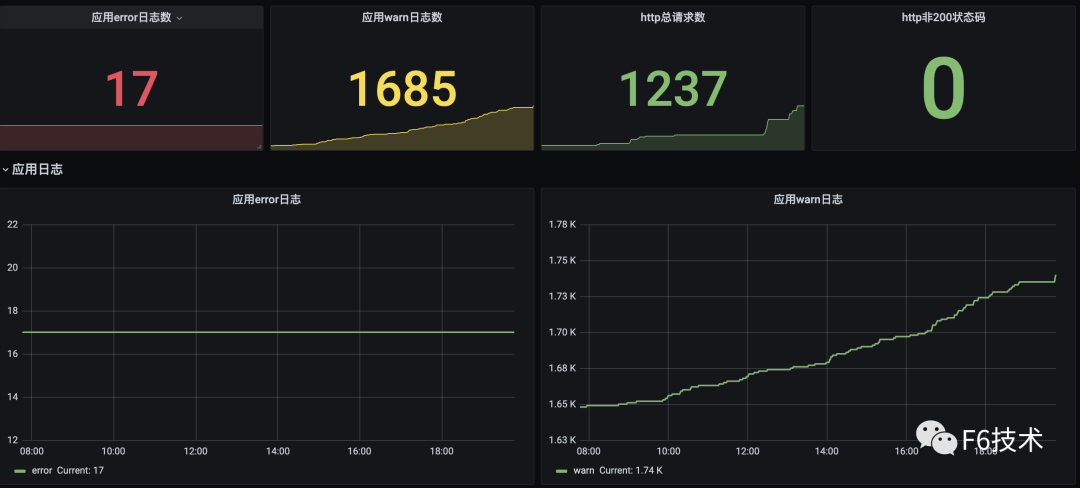
3. 可以在一个 dasborad 添加多个看板,构成监控大盘。
精准告警
任何系统都不是完美的,当出现异常和故障时,能在第一时间发现问题且快速定位问题原因就尤为重要。但要想做到以上这两点,只有数据收集是不够的,需要依赖完善的监控和告警体系,迅速反应并发出告警。
我们最初的方案是,基于 Prometheus operator 的 PrometheusRule 创建告警规则, Prometheus servers 把告警发送给 Alertmanager,Alertmanager 负责把告警发到钉钉群机器人。但是这样运行一段时间之后,我们发现这种方式存在一些问题。SRE 团队和研发团队负责人收到的告警太多,所有的告警都发到一个群里,打开群消息,满屏的告警标题,告警级别,告警值。其中有需要运维处理的系统告警,有需要研发处理的应用告警,信息太多,很难快速筛选出高优先级的告警,很难快速转派告警到对应的处理人。所以我们希望应用告警可以精准发送到应用归属的研发团队。
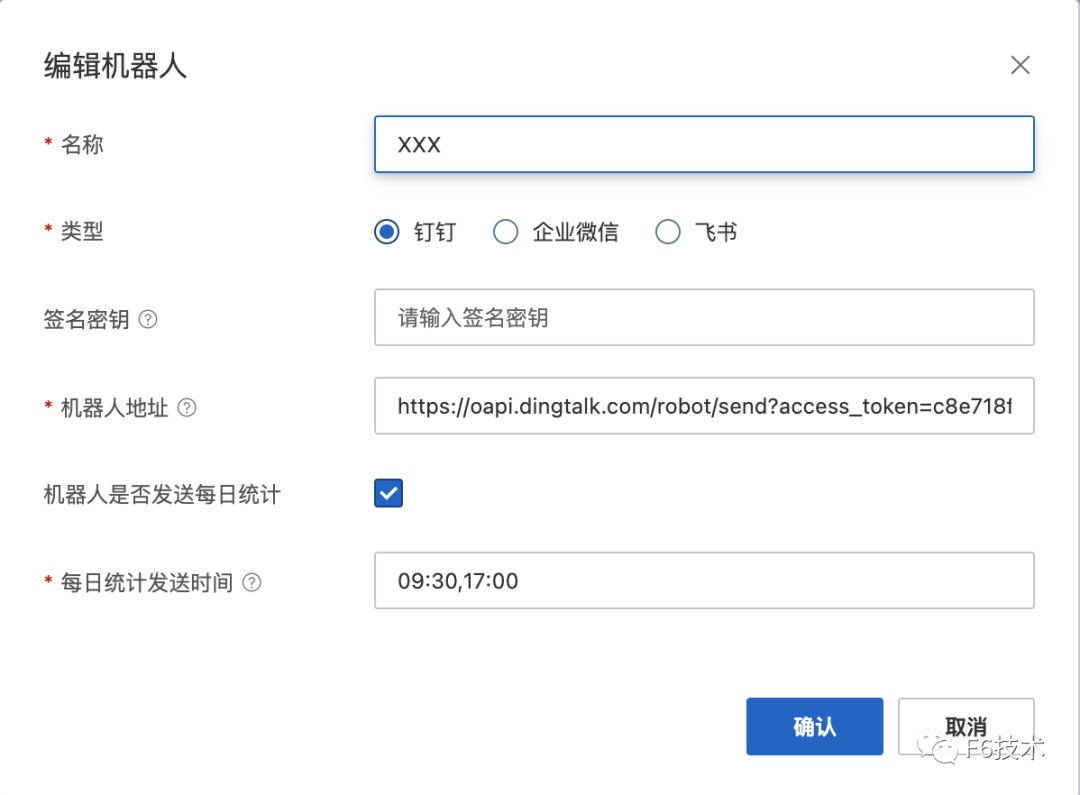
经过一段时间的调研,我们最终选择阿里云的《ARMS 告警运维中心》来负责告警的管理。ARMS 告警运维中心支持接入 Prometheus 数据源,支持添加钉钉群机器人作为联系人。
1. 收集研发团队的钉钉群机器人的 webhook 地址,创建机器人作为联系人。
2. 给每个研发团队分别配置通知策略,通知策略筛选告警信息里的 team 字段,并绑定对应的钉钉群机器人联系人。
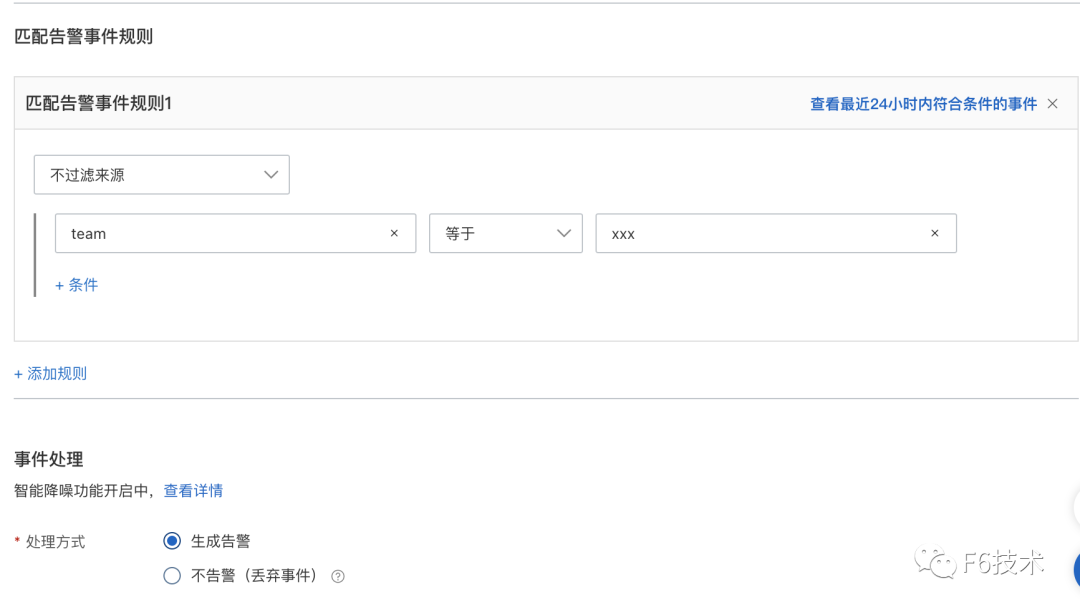
通过这个方式,实现了应用的告警直接发送到对应的研发团队,节省了信息筛选和二次转派的时间,提高了告警处理效率。
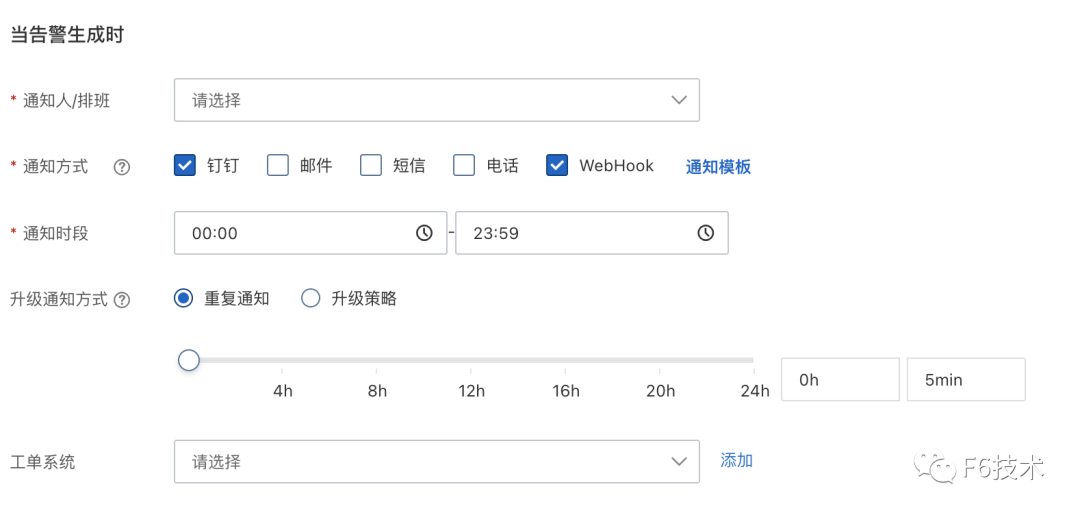
效果如下:

ARMS 告警运维中心支持接入 grafana,zabbix,arms 等多种数据源,具有告警分派和认领,告警汇总去重,通过升级通知方式对长时间没有处理的告警进行多次提醒,或升级通知到领导,保证告警及时解决。
本文为阿里云原创内容,未经允许不得转载。