 1 # -*- coding: utf-8 -*-
 2 """
 3 Created on Fri Sep 21 15:37:26 2018
 4
 5 @author: zhen
 6 """
 7 from PIL import Image
 8 import numpy as np
 9 from sklearn.cluster import KMeans
10 import matplotlib
11 import matplotlib.pyplot as plt
12
13 def restore_image(cb, cluster, shape):
14     row, col, dummy = shape
15     image = np.empty((row, col, dummy))
16     for r in range(row):
17         for c in range(col):
18             image[r, c] = cb[cluster[r * col + c]]
19     return image
20
21 def show_scatter(a):
22     N = 10
23     density, edges = np.histogramdd(a, bins=[N, N, N], range=[(0, 1), (0, 1), (0, 1)])
24     density /= density.max()
25     x = y = z = np.arange(N)
26     d = np.meshgrid(x, y, z)
27
28     fig = plt.figure(1, facecolor='w')
29     ax = fig.add_subplot(111, projection='3d')
30
31     cm = matplotlib.colors.ListedColormap(list('rgbm'))
32     ax.scatter(d[0], d[1], d[2], s=100 * density, cmap=cm, marker='o', depthshade=True)
33     ax.set_xlabel(u'红')
34     ax.set_ylabel(u'绿')
35     ax.set_zlabel(u'蓝')
36     plt.title(u'图像颜色三维频数分布', fontsize=20)
37
38     plt.figure(2, facecolor='w')
39     den = density[density > 0]
40     den = np.sort(den)[::-1]
41     t = np.arange(len(den))
42     plt.plot(t, den, 'r-', t, den, 'go', lw=2)
43     plt.title(u'图像颜色频数分布', fontsize=18)
44     plt.grid(True)
45
46     plt.show()
47
48 if __name__ == '__main__':
49     matplotlib.rcParams['font.sans-serif'] = [u'SimHei']
50     matplotlib.rcParams['axes.unicode_minus'] = False
51     # 聚类数2,6,30
52     num_vq = 2
53     im = Image.open('C:/Users/zhen/.spyder-py3/images/Lena.png')
54     image = np.array(im).astype(np.float) / 255
55     image = image[:, :, :3]
56     image_v = image.reshape((-1, 3))
57     kmeans = KMeans(n_clusters=num_vq, init='k-means++')
58     show_scatter(image_v)
59
60     N = image_v.shape[0]  # 图像像素总数
61     # 选择样本,计算聚类中心
62     idx = np.random.randint(0, N, size=int(N * 0.7))
63     image_sample = image_v[idx]
64     kmeans.fit(image_sample)
65     result = kmeans.predict(image_v)  # 聚类结果
66     print('聚类结果:
', result)
67     print('聚类中心:
', kmeans.cluster_centers_)
68
69     plt.figure(figsize=(15, 8), facecolor='w')
70     plt.subplot(211)
71     plt.axis('off')
72     plt.title(u'原始图片', fontsize=18)
73     plt.imshow(image)
74     # plt.savefig('原始图片.png')
75
76     plt.subplot(212)
77     vq_image = restore_image(kmeans.cluster_centers_, result, image.shape)
78     plt.axis('off')
79     plt.title(u'聚类个数:%d' % num_vq, fontsize=20)
80     plt.imshow(vq_image)
81     # plt.savefig('矢量化图片.png')
82
83     plt.tight_layout(1.2)
84     plt.show()
结果:

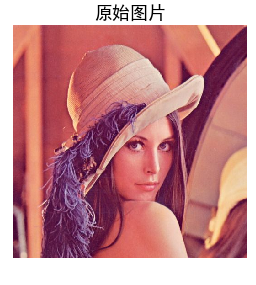
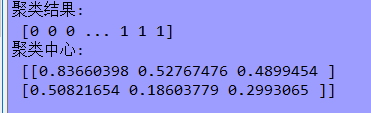
1.当k=2时:

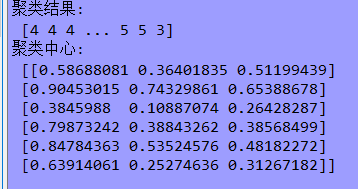
2.当k=6时:

3.当k=30时:

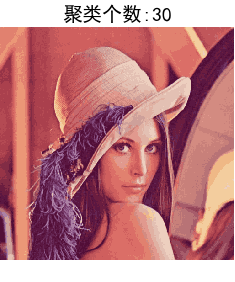
总结:当聚类个数较少时,算法运算速度快但效果较差,当聚类个数较多时,运算速度慢效果好但容易过拟合,所以恰当的k值对于聚类来说影响极其明显!!