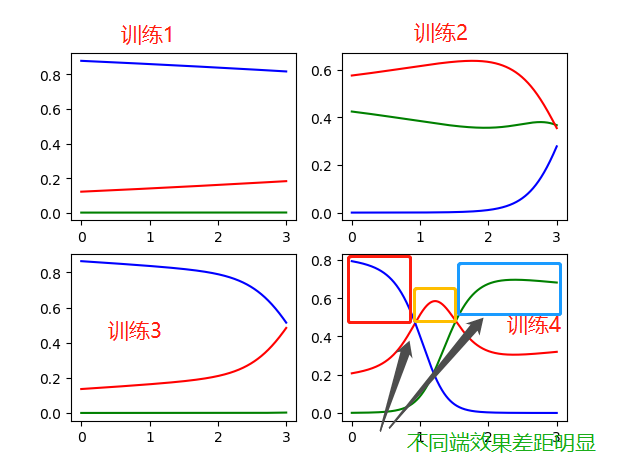
代码:
 1 import numpy as np
 2 from sklearn import datasets
 3 from sklearn.linear_model import LogisticRegression
 4 import matplotlib.pyplot as plt
 5
 6 __author__ = 'zhen'
 7
 8 iris = datasets.load_iris()
 9
10 for i in range(0, 4):
11     x = iris['data'][:, i:i+1]  # 获取训练数据
12     y = iris['target']
13
14     param_grid = {"tol": [1e-4, 1e-3, 1e-2], "C": [0.4, 0.6, 0.8]}
15
16     log_reg = LogisticRegression(multi_class='ovr', solver='sag', max_iter=1000)  # ovr:二分类
17     log_reg.fit(x, y)
18
19     # 改变数据的样式,reshape(rows, columns),当rows=-1时,表示任意行
20     x_new = np.linspace(0, 3, 1000).reshape(-1, 1)
21
22     y_proba = log_reg.predict_proba(x_new)
23     y_hat = log_reg.predict(x_new)
24
25     print("y_prob:
{}
y_hat
{}".format(y_proba, y_hat[:: 10]))
26     print("="*60)
27
28     # 画图
29     plt.subplot(2, 2, i+1)
30     plt.plot(x_new, y_proba[:, 2], 'g-', label='Iris-Virginica')
31     plt.plot(x_new, y_proba[:, 1], 'r-', label='Iris-Versicolour')
32     plt.plot(x_new, y_proba[:, 0], 'b-', label='Iris-Setosa')
33
34     if i == 3:
35         plt.show()
结果:
训练1:
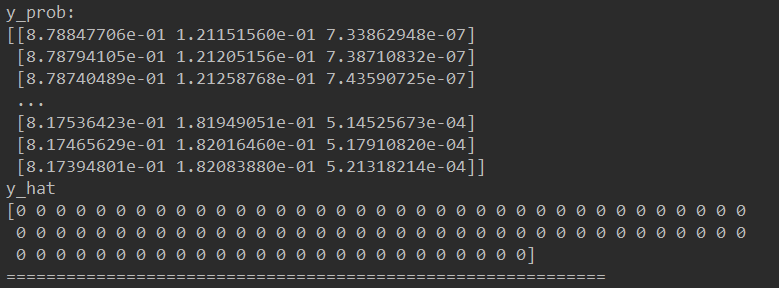
训练2:
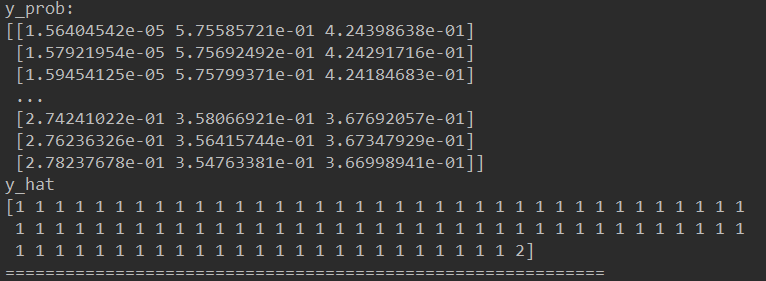
训练3:
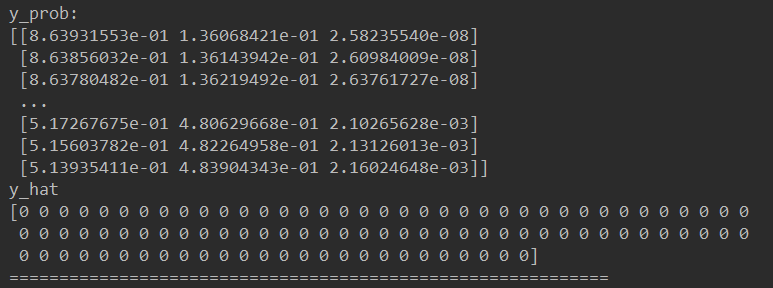
训练4:
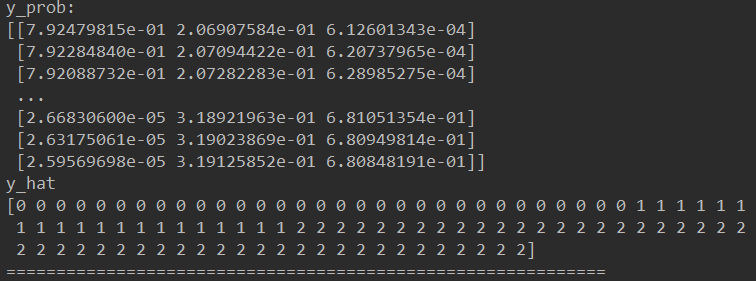
分析:
有训练结果可知,训练4最具有合理性(分类清晰):
