最近根据领导的指示,需要实现一个中国地图的可视化全国的销售数量,因为我一直是后台开发的人员,对typescript中的强类型比较感兴趣同时数据交互react也很好的实现数据的绑定。经过长达很久的探索,完成了这块的内容。
环境配置:
"echarts": "^5.1.2",
"echarts-for-react": "^3.0.1",
"typescript": "^4.1.2",
如果你的环境中有 ts+react 又想要使用echart 建议看这个
1. 安装依赖
npm install echarts --save
npm install echarts-for-react
2. 配置环境
创建echarts.d.ts  echarts-for-react.d.ts连个declare文件


编辑并declare modul
declare module 'echarts/lib/echarts';
 declare module 'echarts-for-react';
3. demo测试
导入包
import ReactECharts from "echarts-for-react";
import {EChartsOption} from "echarts";

配置option
config : {
    title : {
        text : "机械臂全球销售记录"
    },
    tooltip : {
        trigger : "axis"
    },
    xAxis : {
        type :"category",
        data : ["星期一","星期二","星期三","星期四","星期五","星期六","星期日"]
    },
    yAxis : {
        type : "value"
    },
    series : [
        {
            name : "机械臂销售数据",
            type :"bar",
            data : ["10","20","15","8","23","40","32"]
        }
    ]
}
引入使用
<ReactECharts option={this.state.config} />
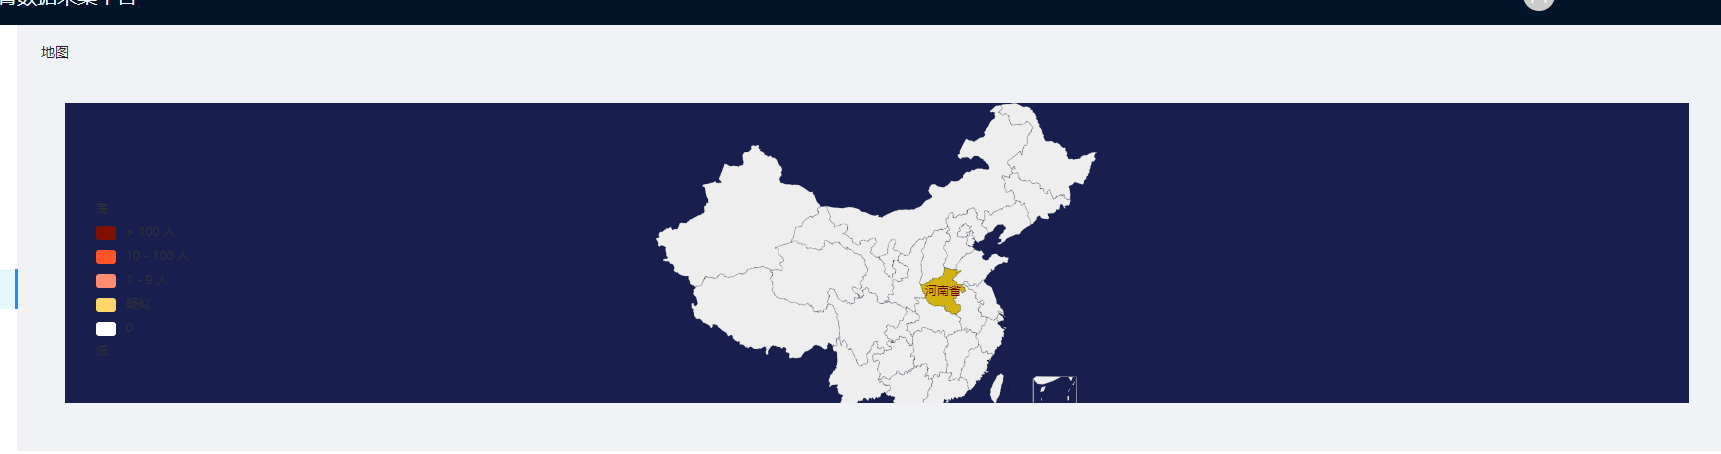
效果如图所示:


4. 测试成功之后可以正式使用geoJson绘制中国地图
5. 选择geoJso 提供阿里的绘图数据
http://datav.aliyun.com/tools/atlas/index.html


复制复制之后,在文档中新建json文件

6. 引用json文件
import ReactECharts from 'echarts-for-react';
import * as echarts from "echarts";
import {EChartsOption} from "echarts";


// echarts.registerTheme('my_theme', {
//     backgroundColor: '#181F4E'
// })
echarts.registerMap("china",require("../../config/china.json")); //这个步骤很关键,注册之后的名字与geo组件之间或者series保持一致
7. 配置option
this.state = {
    config: {
        tooltip: {
            trigger: "axis"
        },
        visualMap: {
            min: 0,
            max: 1000,
            left: 26,
            bottom: 40,
            showLabel: !0,
            text: ["高", "低"],
            pieces: [{
                gt: 100,
                label: "> 100 人",
                color: "#7f1100"
            }, {
                gte: 10,
                lte: 100,
                label: "10 - 100 人",
                color: "#ff5428"
            }, {
                gte: 1,
                lt: 10,
                label: "1 - 9 人",
                color: "#ff8c71"
            }, {
                gt: 0,
                lt: 1,
                label: "疑似",
                color: "#ffd768"
            }, {
                value: 0,
                color: "#ffffff"
            }],
            show: !0
        },
        geo: {
            map: "china",
            roam: !1,
            scaleLimit: {
                min: 1,
                max: 2
            },
            zoom: 1.23,
            top: 120,
            itemStyle: {
                borderColor: "rgba(0, 0, 0, 0.2)"
            },
            emphasis: {
                areaColor: "#f2d5ad",
                shadowOffsetX: 0,
                shadowOffsetY: 0,
                borderWidth: 0
            }
        },
        series: [{
            name: "机械臂全国销售数量",
            type: "map",
            map: "china",
            geoIndex: 0,
            data: data
        }]
    }
}

8. 引用运行
9. 完整的代码
import React, {Component} from 'react';

import ReactECharts from 'echarts-for-react';
import * as echarts from "echarts";
import {EChartsOption} from "echarts";


echarts.registerTheme('my_theme', {
    backgroundColor: '#181F4E'
})
echarts.registerMap("china",require("../../config/china.json"));

interface IState {
    config : EChartsOption
}
class MapChina extends Component<any,IState> {

    constructor(props: any, context: any) {
        super(props, context);
        const data = [{name: "合肥", value: 20},
            {name: "江苏", value: 10},
            {name: "南京", value: 30},
            {name: "上海", value: 40}];
        this.state = {
            config: {
                tooltip: {
                    trigger: "axis"
                },
                visualMap: {
                    min: 0,
                    max: 1000,
                    left: 26,
                    bottom: 40,
                    showLabel: !0,
                    text: ["高", "低"],
                    pieces: [{
                        gt: 100,
                        label: "> 100 人",
                        color: "#7f1100"
                    }, {
                        gte: 10,
                        lte: 100,
                        label: "10 - 100 人",
                        color: "#ff5428"
                    }, {
                        gte: 1,
                        lt: 10,
                        label: "1 - 9 人",
                        color: "#ff8c71"
                    }, {
                        gt: 0,
                        lt: 1,
                        label: "疑似",
                        color: "#ffd768"
                    }, {
                        value: 0,
                        color: "#ffffff"
                    }],
                    show: !0
                },
                geo: {
                    map: "china",
                    roam: !1,
                    scaleLimit: {
                        min: 1,
                        max: 2
                    },
                    zoom: 2.1,
                    top: 120,
                    itemStyle: {
                        borderColor: "rgba(0, 0, 0, 0.2)"
                    },
                    emphasis: {
                        areaColor: "#f2d5ad",
                        shadowOffsetX: 0,
                        shadowOffsetY: