usage
在使用 gdb debug 程式前,
compile 需要加 -g 產生 debug information,
-g3 為最多 debug information
以及
加 -O0 程式不要優化
gcc -O0 -g3
Do not print the introductory and copyright messages.
-quiet
-q "Quiet". Do not print the introductory and copyright messages. These messages are also suppressed in batch mode.
$ gdb a.out
GNU gdb (Ubuntu 7.7.1-0ubuntu5~14.04.2) 7.7.1
Copyright (C) 2014 Free Software Foundation, Inc.
License GPLv3+: GNU GPL version 3 or later <http://gnu.org/licenses/gpl.html>
This is free software: you are free to change and redistribute it.
There is NO WARRANTY, to the extent permitted by law.  Type "show copying"
and "show warranty" for details.
This GDB was configured as "x86_64-linux-gnu".
Type "show configuration" for configuration details.
For bug reporting instructions, please see:
<http://www.gnu.org/software/gdb/bugs/>.
Find the GDB manual and other documentation resources online at:
<http://www.gnu.org/software/gdb/documentation/>.
For help, type "help".
Type "apropos word" to search for commands related to "word"...
Reading symbols from a.out...done.
(gdb)
$ gdb -q a.out
Reading symbols from a.out...done.
(gdb)
get the address of variable
(gdb) p &a
difference between (gdb)r with (gdb) start
break-through@breakthrough-ThinkPad-T460p:~/working_space/test/5$ gdb -q a.out
Reading symbols from a.out...done.
(gdb) r
Starting program: /home/break-through/working_space/test/5/a.out
test.a = 1, test.b=2, test.c=3
[Inferior 1 (process 7607) exited normally]
(gdb) p &test.a
No symbol "test" in current context.
break-through@breakthrough-ThinkPad-T460p:~/working_space/test/5$ gdb -q a.out
Reading symbols from a.out...done.
(gdb) start
Temporary breakpoint 1 at 0x400535: file container_of.c, line 11.
Starting program: /home/break-through/working_space/test/5/a.out

Temporary breakpoint 1, main () at container_of.c:11
11	        test.a = 1;
(gdb) p &test.a
$1 = (int *) 0x7fffffffddb0
print source code
(gdb) list
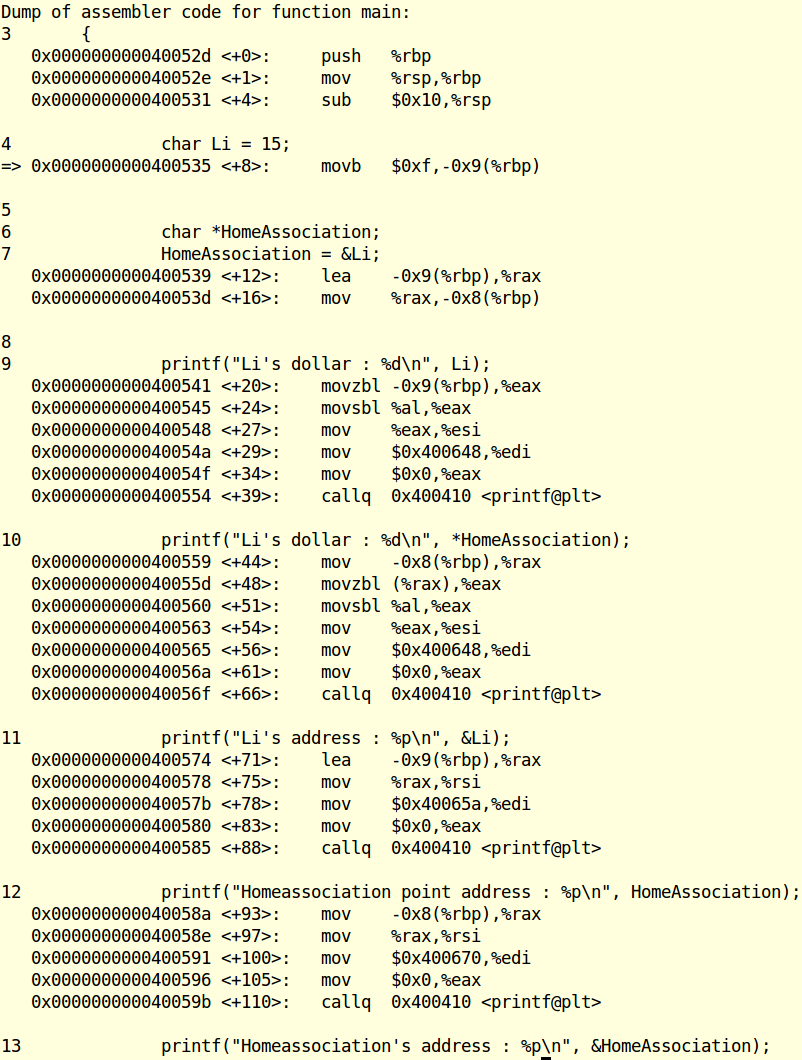
Display assemble code
(gdb) disassemble
Setting breakpoint
(gdb) b line_number
Clear breakpoint
(gdb) clear line_number
Deleting all breakpoints
(gdb) delete
Continue running your program (after stopping, e.g. at a breakpoint).
(gdb) c
Execute next program line
Step into
(gdb) step
Step over
(gdb) next
Watchpoint
Setting watchpoint
(gdb) watch variable_name
(gdb) start
(gdb) watch variable_name
(gdb) c
 // display the old value and new value of the variable if the value changes.
(gdb) c
 // display the old value and new value of the variable if the value changes.
(gdb) c
 // display the old value and new value of the variable if the value changes.
 .....
 .....
 .....
(gdb) start
(gdb) watch variable1_name - 5 + variable2_name
(gdb) c
 // display the old value and new value of the variable if the value changes.
(gdb) c
 // display the old value and new value of the variable if the value changes.
(gdb) c
 // display the old value and new value of the variable if the value changes.
 .....
 .....
 .....
(gdb) start
(gdb) watch *memory_address
(gdb) c
 // display the old content and new content of the memory_address if the content changes.
(gdb) c
 // display the old content and new content of the memory_address if the content changes.
(gdb) c
 // display the old content and new content of the memory_address if the content changes.
 .....
 .....
 .....
Deleting all watchpoints
(gdb) delete
Display register value
movl $0x6,-0x4(%rbp)
(gdb) p $rbp-0x4
Show both source code and assemble code split using TUI (Text User Interface) mode.
gdb -tui <your-binary>
(gdb) layout split
(gdb) start

Show both source code and assemble code mixed.
(gdb) disassemble /m
Display decimal or hexadecimal data
(gdb) p c->seeds[1].score
$19 = 101
(gdb) p /x c->seeds[1].score
$20 = 0x65
List break points
Delete break point
(gdb) info break
Num Type Disp Enb Address What
1 breakpoint keep y 0x00000000004576e8 in mem_matesw at bwamem_pair.c:112
breakpoint already hit 2 times
2 breakpoint keep y 0x0000000000457b93 in mem_matesw at bwamem_pair.c:145
breakpoint already hit 1 time
3 breakpoint keep y 0x0000000000457b12 in mem_matesw at bwamem_pair.c:142
(gdb) del 1
(gdb) info break
Num Type Disp Enb Address What
2 breakpoint keep y 0x0000000000457b93 in mem_matesw at bwamem_pair.c:145
breakpoint already hit 1 time
3 breakpoint keep y 0x0000000000457b12 in mem_matesw at bwamem_pair.c:142
(gdb)
Set new variable outside of program
(gdb) p $test = "B"
檢視 memory value
(gdb) x /abc address
a : lenth to display
b : format o:octal x:hex ...
c : unit b:byte h:halfword
ex:
(gdb) x /3xb fp->compressed_block
0x7ffff7fc2010: 0x42    0x41    0x4d
Reference:
太多了!
To be continued