图像放缩:使用双线性插值法和双三次插值法
-
Introduction
In this experiment, matalb is used to zooming and shrinking an image, to find out the difference between source image and processed image. Firstly zoom the image and then shrink the zoomed image to original size, compare the processed image and the original one, see the difference.
-
Experimental Settings
Use a highly textured image as input, the function imresize() in matlab is used.
-
Results and Discussion
-
Experiment 1: Enlarge the image by 2.6 along rows, shrunk by 1.3 along columns


Figure 1
-
Experiment 2: Inverse transforming the resulting images in Figure 1
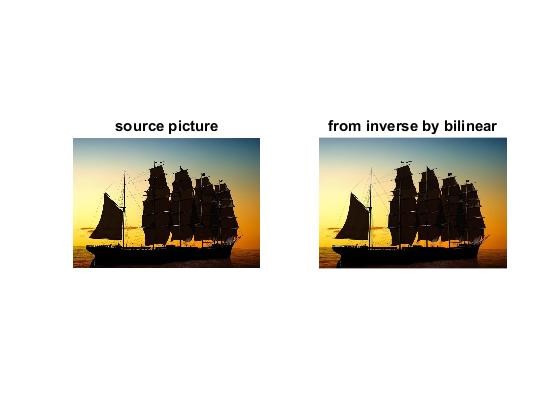

Figure 2
-
Experiment 3: The difference between the original input image and the resulting images in Figure 2

Figure 3
The dark pixels of Figure 3 show the difference between the original input image and the resulting images in Figure 2, the bright pixels mean the two images are almost the same.
The difference between the two pictures in Figure 3 can be seen, the picture processed by bilinear changes a lot from the source image, so we can think that process image by bicubic is more accurate.
- source code(matlab代码)
- process_by_bicubic.m
clc   % 清除命令窗口的内容
clear   % 清除工作空间的所有变量
close all   % 关闭所有的Figure窗口

I = imread('01.jpg');   % 读取图片
[m,n]=size(I);
n = n / 3;      %图片的长宽
figure(1);      % 第1张图:显示原图和处理后的图像
subplot(1,2,1);
imshow(I,[]);   % 显示原始图形
title('source picture');  % 为画好的图加上标题

B=imresize(I, [2.6 * m, n / 1.3], 'bicubic');    %使用双三次插值
subplot(1,2,2);
imshow(B,[]);   % 显示B图形
title('2.6 * rows, columns / 1.3 by bicubic');  % 为画好的图加上标题

%***********************************************************************
figure(2);      % 第2张图:显示原图和放大后又恢复原大小的图像
subplot(1,2,1);
imshow(I,[]);   % 显示原始图形
title('source picture');  % 为画好的图加上标题

C=imresize(B, [m, n], 'bicubic');    %使用双三次插值,恢复原分辨率
subplot(1,2,2);
imshow(C,[]);   % 显示C图形
title('from inverse by bicubic');  % 为画好的图加上标题

%***********************************************************************
figure(3);      % 第3张图:显示原图和恢复后的图有什么不同
D = C - I;      % D可视为C和I的不同,但求D的负片可以使结果更易观察
%imshow(D,[]);   % 显示D图形
%title('Difference between original and resulting images in Figure 2');  % 为画好的图加上标题

E=imadjust(D,[0 1],[1 0]);
imshow(E,[]);   % 显示E图形
title('Difference between original and resulting images in Figure 2 (by bicubic)');  % 为画好的图加上标题
- process_by_bilinear.m
clc   % 清除命令窗口的内容
clear   % 清除工作空间的所有变量
close all   % 关闭所有的Figure窗口

I = imread('01.jpg');   % 读取图片
[m,n]=size(I);
n = n / 3;      %图片的长宽
figure(1);      % 第1张图:显示原图和处理后的图像
subplot(1,2,1);
imshow(I,[]);   % 显示原始图形
title('source picture');  % 为画好的图加上标题

B=imresize(I, [2.6 * m, n / 1.3], 'bilinear');    %使用双线性插值
subplot(1,2,2);
imshow(B,[]);   % 显示B图形
title('2.6 * rows, columns / 1.3 by bilinear');  % 为画好的图加上标题

%***********************************************************************
figure(2);      % 第2张图:显示原图和放大后又恢复原大小的图像
subplot(1,2,1);
imshow(I,[]);   % 显示原始图形
title('source picture');  % 为画好的图加上标题

C=imresize(B, [m, n], 'bilinear');    %使用双线性插值,恢复原分辨率
subplot(1,2,2);
imshow(C,[]);   % 显示C图形
title('from inverse by bilinear');  % 为画好的图加上标题

%***********************************************************************
figure(3);      % 第3张图:显示原图和恢复后的图有什么不同
D = C - I;      % D可视为C和I的不同,但求D的负片可以使结果更易观察
%imshow(D,[]);   % 显示D图形
%title('Difference between original and resulting images in Figure 2');  % 为画好的图加上标题

E=imadjust(D,[0 1],[1 0]);
imshow(E,[]);   % 显示E图形
title('Difference between original and resulting images in Figure 2 (by bilinear)');  % 为画好的图加上标题
- process_by_bicubic.m