WEB端代码简单展示:
<html lang="en">
<head>
<meta charset="UTF-8">
<meta name="viewport" content="width=device-width, initial-scale=1.0">
<title>Document</title>
<!-- JQ、Bootstrap -->
<link rel="stylesheet" href="static/css/bootstrap.min.css">
<script
src="https://hm.baidu.com/hm.js?eaa57ca47dacb4ad4f5a257001a3457c"></script>
<script src="static/js/jquery.js"></script>
<script src="static/js/bootstrap.min.js"></script>
<link rel="stylesheet" href="static/css/index2.css">
<script src="static/js/echarts.min.js"></script>
<script src="static/js/world.js"></script>
<script>
var formaDate = function() {
var d = new Date()
var year = d.getFullYear(), //多变量赋值
month = d.getMonth() + 1, //month:从0开始
date = d.getDate(),
hour = d.getHours(),
minute = d.getMinutes(),
second = d.getSeconds();
year = year < 10 ? '0' + year : year; //三元操作符
month = month < 10 ? '0' + month : month;
date = date < 10 ? '0' + date : date;
hour = hour < 10 ? '0' + hour : hour;
minute = minute < 10 ? '0' + minute : minute;
second = second < 10 ? '0' + second : second;
var a = year + '-' + month + '-' + date + ' ' + hour + ':' + minute + ':' + second;
$('.showTime').html("<p>"+a+"</p>");
window.addEventListener("resize", () => {
var w = document.documentElement.clientWidth;
var ST = document.getElementById('ST');
if (w < 720) {
ST.style.display = 'none'
} else {
ST.style.display = 'block'
}
});
}
setInterval(formaDate, 1000)
//各州累计确诊分布模块
$(function() {
var myChart = echarts.init(document.querySelector(".bar .chart"));
//指定配置项和数据
var option = {
legend: {
top: 'bottom'
},
title: {
show: true,
x: 'center'
},
color: ['#37a2da', '#9fe6b8', '#ffdb5c', '#ff9f7f', '#fb7293', '#8378ea', '#00d887'],
tooltip: {
trigger: 'item',
formatter: "{a} <br/>{b} : {c} ({d}%)"
},
toolbox: {
show: true,
feature: {
mark: {show: true},
dataView: {show: true, readOnly: false},
restore: {show: true},
saveAsImage: {show: true}
}
},
series: [{
name: '累计确诊',
type: 'pie',
radius: [20, 70],
center: ['50%', '50%'],
roseType: 'radius',
label: {
show: true
},
emphasis: {
label: {
show: true
}
}
}]
};
//配置项设置给ECarts实例对象
myChart.setOption(option);
var count = [];
$.ajax({
url: 'https://api.inews.qq.com/newsqa/v1/automation/modules/list?modules=FAutoGlobalStatis,FAutoContinentStatis,FAutoGlobalDailyList,FAutoCountryConfirmAdd',
type: 'get',
// data: {},
dataType: 'json',
success: function(data) {
var a = data.data.FAutoContinentStatis.length - 1
var contines = data.data.FAutoContinentStatis[a].statis
var con = Object.keys(contines)
var sum = Object.values(contines)
for (var i = 0; i < con.length; i++) {
count.push({ value: sum[i], name: con[i] })
}
myChart.setOption({
series: [{
data: count
}]
})
}
})
window.addEventListener('resize', function() {
myChart.resize();
})
});
// 全球疫情确诊图模块
$(function() {
// 基于准备好的dom,初始化echarts实例
var myChart = echarts.init(document.querySelector(".bar1 .chart"));
option = {
title: {
subtext: '前15个国家',
left: 'center'
},
dataset: {
source: [
['Country', 'Confirmed']
]
},
tooltip: {
trigger: 'item',
formatter: '{a} <br/>{c} ({d}%)'
},
series: [{
name: '确诊人数',
type: 'pie',
clockWise: false,
radius: [30, 460],
center: ['73%', '80%'],
roseType: 'area',
encode: {
itemName: 'Country',
value: 'Confirmed'
},
itemStyle: {
normal: {
color: function(params) {
var colorList = [
"#a71a4f", "#c71b1b", "#d93824", "#e7741b", "#dc9e31", "#d2b130", "#8cc13f", "#53b440", "#48af54", "#479c7f", "#48a698", "#57868c"
];
return colorList[params.dataIndex]
},
label: {
position: 'inside',
textStyle: {
fontWeight: 'bold',
fontFamily: 'Microsoft YaHei',
color: '#FAFAFA',
fontSize: 10
},
formatter: function(params) {
if (params.data[1] > 9000) { return params.data[0] } else { return ""; }
}
}
}
}
}
]
};
myChart.setOption(option);
var virus = [
['Country', 'Confirmed']
]
$.ajax({
url: 'https://api.inews.qq.com/newsqa/v1/automation/foreign/country/ranklist',
type: 'get',
dataType: 'json',
success: function(data) {
var num = data.data
for (var i = 0; i < 15; i++) {
virus.push([num[i].name, num[i].confirm])
}
// myChart.hideLoading()
//必须在这里在设置一遍,这里涉及到的问题不太懂,只知道如不再设置,而在ajax外赋值是没有作用的
myChart.setOption({ //加载数据图表
dataset: {
source: virus
}
})
}
})
window.addEventListener("resize", function() {
myChart.resize();
});
});
//确诊趋势模块
$(function() {
var myChart = echarts.init(document.querySelector('.line .chart'))
var option = {
tooltip: {
trigger: 'axis',
},
//图例
legend: {
top: "0%",
//图例字体样式
textStyle: {
color: "rgba(255,255,255,.5)",
fontSize: "12"
}
},
// 坐标系
grid: {
top: '20%',
left: '16.5%',
right: '1%',
bottom: '10%',
containLabel: false, //grid 区域是否包含坐标轴的刻度标签
},
xAxis: [{
type: 'category',
boundaryGap: true,
// data: ['二月', '三月', '四月', '五月', '六月'],
// 文本颜色为rgba(255,255,255,.6) 文字大小为 12
axisLabel: {
textStyle: {
color: "rgba(255,255,255,.6)",
fontSize: 12
}
},
// x轴线的颜色为 rgba(255,255,255,.2)
axisLine: {
lineStyle: {
color: "rgba(255,255,255,.2)"
}
},
}],
yAxis: [{
type: 'value',
//隐藏坐标轴刻度
axisTick: { show: false },
//标注y轴线样式
axisLine: {
lineStyle: {
color: "rgba(255,255,255,.1)"
}
},
//标注文本
axisLabel: {
textStyle: {
color: "rgba(255,255,255,.6)",
fontSize: 8
}
},
// 修改分割线的颜色
splitLine: {
lineStyle: {
color: "rgba(255,255,255,.1)"
}
}
}],
//主题样式设计
series: [{
name: '累计确诊',
type: 'line',
smooth: true,
// 单独修改线的样式
lineStyle: {
color: "red",
2
},
//开始不显示坐标圆点
showSymbol: false,
},
{
// 开始不显示拐点, 鼠标经过显示
showSymbol: false,
name: "累计死亡",
type: "line",
smooth: true,
lineStyle: {
normal: {
color: "white",
2
}
},
areaStyle: {
normal: {
color: new echarts.graphic.LinearGradient(
0,
0,
0,
1,
[{
offset: 0,
color: "rgba(0, 216, 135, 0.4)"
},
{
offset: 0.8,
color: "rgba(0, 216, 135, 0.1)"
}
],
false
),
shadowColor: "rgba(0, 0, 0, 0.1)"
}
},
// 开始不显示拐点, 鼠标经过显示
showSymbol: false,
}
]
};
// 把配置和数据给实例对象
myChart.setOption(option);
var count = []
var count1 = []
var date = []
$.ajax({
url: 'https://api.inews.qq.com/newsqa/v1/automation/modules/list?modules=FAutoGlobalStatis,FAutoContinentStatis,FAutoGlobalDailyList,FAutoCountryConfirmAdd',
type: 'get',
dataType: 'json',
success: function(data) {
var qushi = data.data.FAutoGlobalDailyList
for (var i = 0; i < qushi.length; i++) {
count.push(qushi[i].all.confirm)
count1.push(qushi[i].all.dead)
date.push(qushi[i].date)
}
myChart.setOption({
series: [{
data: count
}, {
data: count1
}],
xAxis: [{
data: date
}]
})
}
})
window.addEventListener('resize', function() {
myChart.resize()
})
});
//地图模块
$(function() {
var myChart = echarts.init(document.querySelector('.map .chart'))
var nameMap = {
"Canada": "加拿大",
"Turkmenistan": "土库曼斯坦",
"Saint Helena": "圣赫勒拿",
"Lao PDR": "老挝",
"Lithuania": "立陶宛",
"Cambodia": "柬埔寨",
"Ethiopia": "埃塞俄比亚",
"Faeroe Is.": "法罗群岛",
"Swaziland": "斯威士兰",
"Palestine": "巴勒斯坦",
"Belize": "伯利兹",
"Argentina": "阿根廷",
"Bolivia": "玻利维亚",
"Cameroon": "喀麦隆",
"Burkina Faso": "布基纳法索",
"Aland": "奥兰群岛",
"Bahrain": "巴林",
"Saudi Arabia": "沙特阿拉伯",
"Fr. Polynesia": "法属波利尼西亚",
"Cape Verde": "佛得角",
"W. Sahara": "西撒哈拉",
"Slovenia": "斯洛文尼亚",
"Guatemala": "危地马拉",
"Guinea": "几内亚",
"Dem. Rep. Congo": "刚果(金)",
"Germany": "德国",
"Spain": "西班牙",
"Liberia": "利比里亚",
"Netherlands": "荷兰",
"Jamaica": "牙买加",
"Solomon Is.": "所罗门群岛",
"Oman": "阿曼",
"Tanzania": "坦桑尼亚",
"Costa Rica": "哥斯达黎加",
"Isle of Man": "曼岛",
"Gabon": "加蓬",
"Niue": "纽埃",
"Bahamas": "巴哈马",
"New Zealand": "新西兰",
"Yemen": "也门",
"Jersey": "泽西岛",
"Pakistan": "巴基斯坦",
"Albania": "阿尔巴尼亚",
"Samoa": "萨摩亚",
"Czech Rep.": "捷克",
"United Arab Emirates": "阿拉伯联合酋长国",
"Guam": "关岛",
"India": "印度",
"Azerbaijan": "阿塞拜疆",
"N. Mariana Is.": "北马里亚纳群岛",
"Lesotho": "莱索托",
"Kenya": "肯尼亚",
"Belarus": "白俄罗斯",
"Tajikistan": "塔吉克斯坦",
"Turkey": "土耳其",
"Afghanistan": "阿富汗",
"Bangladesh": "孟加拉国",
"Mauritania": "毛里塔尼亚",
"Dem. Rep. Korea": "朝鲜",
"Saint Lucia": "圣卢西亚",
"Br. Indian Ocean Ter.": "英属印度洋领地",
"Mongolia": "蒙古",
"France": "法国",
"Cura?ao": "库拉索岛",
"S. Sudan": "南苏丹",
"Rwanda": "卢旺达",
"Slovakia": "斯洛伐克",
"Somalia": "索马里",
"Peru": "秘鲁",
"Vanuatu": "瓦努阿图",
"Norway": "挪威",
"Malawi": "马拉维",
"Benin": "贝宁",
"St. Vin. and Gren.": "圣文森特和格林纳丁斯",
"Korea": "韩国",
"Singapore": "新加坡",
"Montenegro": "黑山共和国",
"Cayman Is.": "开曼群岛",
"Togo": "多哥",
"China": "中国",
"Heard I. and McDonald Is.": "赫德岛和麦克唐纳群岛",
"Armenia": "亚美尼亚",
"Falkland Is.": "马尔维纳斯群岛(福克兰)",
"Ukraine": "乌克兰",
"Ghana": "加纳",
"Tonga": "汤加",
"Finland": "芬兰",
"Libya": "利比亚",
"Dominican Rep.": "多米尼加",
"Indonesia": "印度尼西亚",
"Mauritius": "毛里求斯",
"Eq. Guinea": "赤道几内亚",
"Sweden": "瑞典",
"Vietnam": "越南",
"Mali": "马里",
"Russia": "俄罗斯",
"Bulgaria": "保加利亚",
"United States": "美国",
"Romania": "罗马尼亚",
"Angola": "安哥拉",
"Chad": "乍得",
"South Africa": "南非",
"Fiji": "斐济",
"Liechtenstein": "列支敦士登",
"Malaysia": "马来西亚",
"Austria": "奥地利",
"Mozambique": "莫桑比克",
"Uganda": "乌干达",
"Japan": "日本本土",
"Niger": "尼日尔",
"Brazil": "巴西",
"Kuwait": "科威特",
"Panama": "巴拿马",
"Guyana": "圭亚那",
"Madagascar": "马达加斯加",
"Luxembourg": "卢森堡",
"American Samoa": "美属萨摩亚",
"Andorra": "安道尔",
"Ireland": "爱尔兰",
"Italy": "意大利",
"Nigeria": "尼日利亚",
"Turks and Caicos Is.": "特克斯和凯科斯群岛",
"Ecuador": "厄瓜多尔",
"U.S. Virgin Is.": "美属维尔京群岛",
"Brunei": "文莱",
"Australia": "澳大利亚",
"Iran": "伊朗",
"Algeria": "阿尔及利亚",
"El Salvador": "萨尔瓦多",
"C?te d'Ivoire": "科特迪瓦",
"Chile": "智利",
"Puerto Rico": "波多黎各",
"Belgium": "比利时",
"Thailand": "泰国",
"Haiti": "海地",
"Iraq": "伊拉克",
"S?o Tomé and Principe": "圣多美和普林西比",
"Sierra Leone": "塞拉利昂",
"Georgia": "格鲁吉亚",
"Denmark": "丹麦",
"Philippines": "菲律宾",
"S. Geo. and S. Sandw. Is.": "南乔治亚岛和南桑威奇群岛",
"Moldova": "摩尔多瓦",
"Morocco": "摩洛哥",
"Namibia": "纳米比亚",
"Malta": "马耳他",
"Guinea-Bissau": "几内亚比绍",
"Kiribati": "基里巴斯",
"Switzerland": "瑞士",
"Grenada": "格林纳达",
"Seychelles": "塞舌尔",
"Portugal": "葡萄牙",
"Estonia": "爱沙尼亚",
"Uruguay": "乌拉圭",
"Antigua and Barb.": "安提瓜和巴布达",
"Lebanon": "黎巴嫩",
"Uzbekistan": "乌兹别克斯坦",
"Tunisia": "突尼斯",
"Djibouti": "吉布提",
"Greenland": "丹麦",
"Timor-Leste": "东帝汶",
"Dominica": "多米尼克",
"Colombia": "哥伦比亚",
"Burundi": "布隆迪",
"Bosnia and Herz.": "波斯尼亚和黑塞哥维那",
"Cyprus": "塞浦路斯",
"Barbados": "巴巴多斯",
"Qatar": "卡塔尔",
"Palau": "帕劳",
"Bhutan": "不丹",
"Sudan": "苏丹",
"Nepal": "尼泊尔",
"Micronesia": "密克罗尼西亚",
"Bermuda": "百慕大",
"Suriname": "苏里南",
"Venezuela": "委内瑞拉",
"Israel": "以色列",
"St. Pierre and Miquelon": "圣皮埃尔和密克隆群岛",
"Central African Rep.": "中非",
"Iceland": "冰岛",
"Zambia": "赞比亚",
"Senegal": "塞内加尔",
"Papua New Guinea": "巴布亚新几内亚",
"Trinidad and Tobago": "特立尼达和多巴哥",
"Zimbabwe": "津巴布韦",
"Jordan": "约旦",
"Gambia": "冈比亚",
"Kazakhstan": "哈萨克斯坦",
"Poland": "波兰",
"Eritrea": "厄立特里亚",
"Kyrgyzstan": "吉尔吉斯斯坦",
"Montserrat": "蒙特塞拉特",
"New Caledonia": "新喀里多尼亚",
"Macedonia": "马其顿",
"Paraguay": "巴拉圭",
"Latvia": "拉脱维亚",
"Hungary": "匈牙利",
"Syria": "叙利亚",
"Honduras": "洪都拉斯",
"Myanmar": "缅甸",
"Mexico": "墨西哥",
"Egypt": "埃及",
"Nicaragua": "尼加拉瓜",
"Cuba": "古巴",
"Serbia": "塞尔维亚",
"Comoros": "科摩罗",
"United Kingdom": "英国",
"Fr. S. Antarctic Lands": "南极洲",
"Congo": "刚果(布)",
"Greece": "希腊",
"Sri Lanka": "斯里兰卡",
"Croatia": "克罗地亚",
"Botswana": "博茨瓦纳",
"Siachen Glacier": "锡亚琴冰川地区"
}
var option = {
title: {
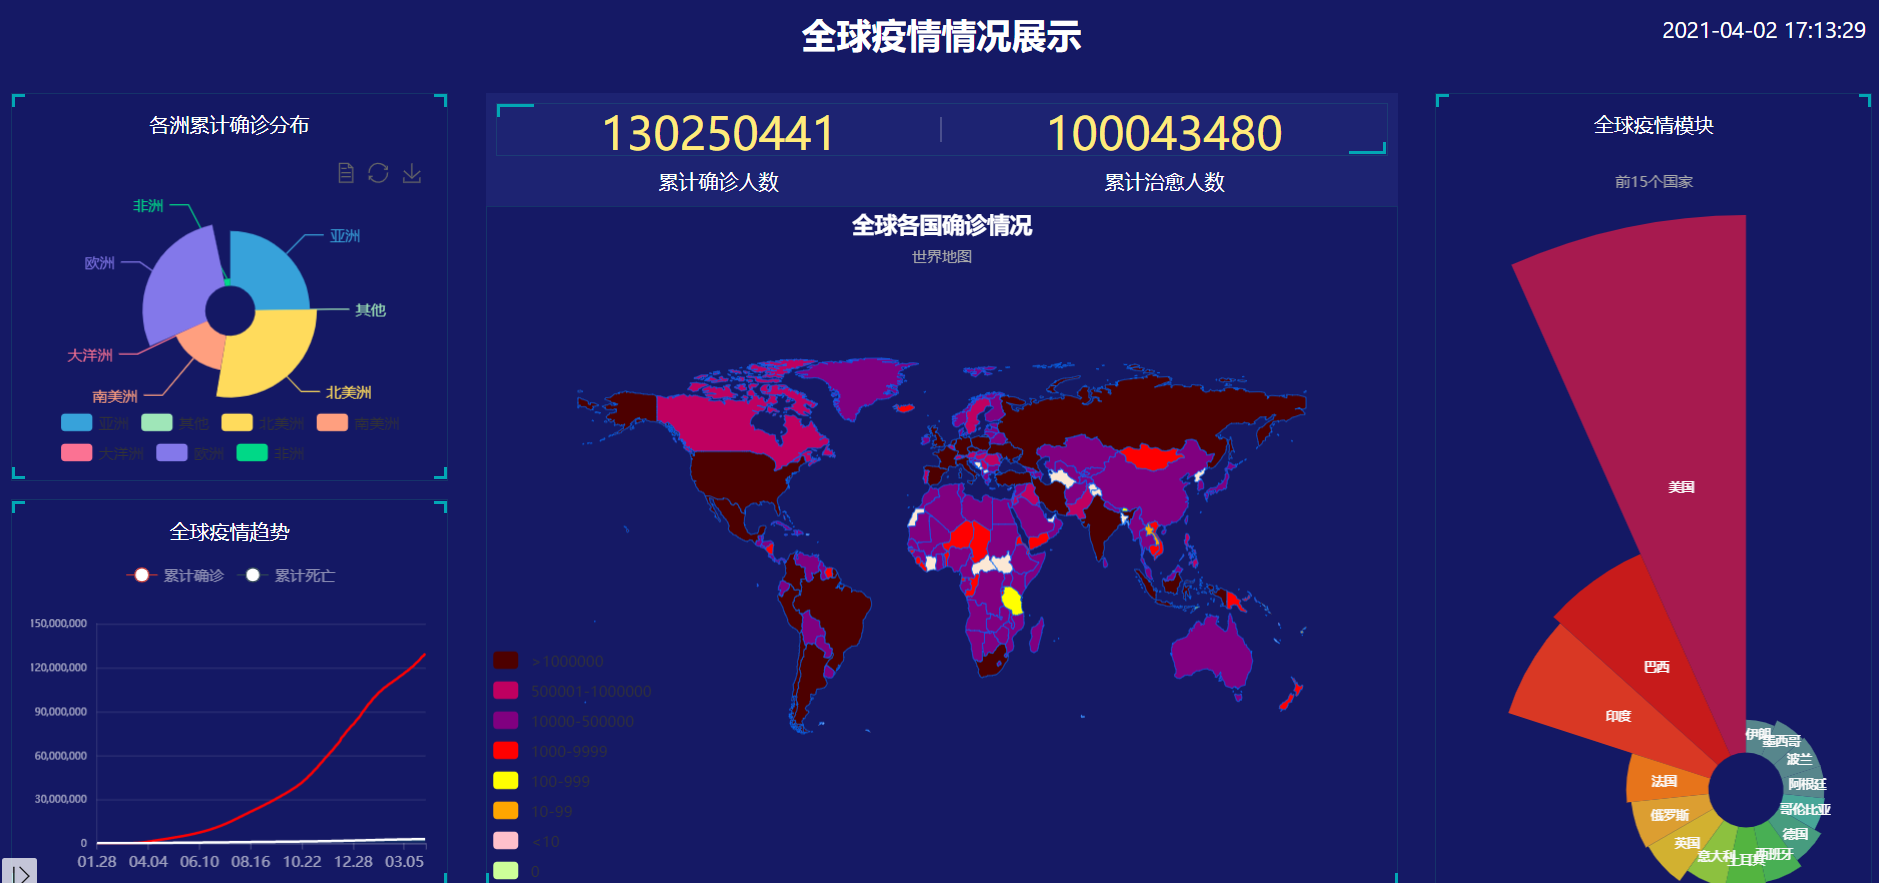
text: '全球各国确诊情况',
subtext: '世界地图',
left: 'center',
textStyle: {
color: 'white'
},
top: 'top'
},
tooltip: {
trigger: 'item',
formatter: function(params) {
var value = params.value + '';
return params.seriesName + '<br/>' + params.name + ' : ' + value + '人';
}
},
visualMap: {
dimension: 0,
pieces: [
{ gt: 1000000,label: '>1000000', color: '#4D0000'},
{ gt: 500000,lte:1000000,label: '500001-1000000', color: '#BF0060' },
{ gt: 9999, lte: 500000,label: '10000-500000', color: 'purple' },
{ gte: 1000, lte: 9999, label: '1000-9999', color: 'red' },
{ gt: 99, lte: 999, label: '100-999', color: 'yellow' },
{ gte: 10, lte: 99, label: '10-99', color: 'orange' },
{ gt: 0, lte: 9, label: '<10', color: 'pink' },
{ value: 0, color: "#ccff99", label: "0" }
]
},
series: [{
name: '累计确诊人数',
type: 'map',
mapType: 'world',
roam: true,
itemStyle: {
normal: {
areaColor: '#fce8d5',
borderColor: 'rgb(0,108,255)',
},
emphasis: {
label: {
show: true,
color: 'black'
},
areaColor: '#fce8d5'
}
},
nameMap: nameMap
}]
};
myChart.setOption(option);
var virus = []
$.ajax({
url: 'https://view.inews.qq.com/g2/getOnsInfo?name=disease_h5',
type: 'get',
dataType: 'jsonp',
success: function(data) {
var res = data.data || "";
res = JSON.parse(res).chinaTotal.confirm;
virus.push({ name: '中国', value: res })
myChart.setOption({
series: [{
data: virus
}]
})
}
});
$.ajax({
url: 'https://api.inews.qq.com/newsqa/v1/automation/foreign/country/ranklist',
type: 'get',
dataType: 'json',
success: function(data) {
var num = data.data
var sum = 0
for (var i = 0; i < num.length; i++) {
virus.push({ name: num[i].name, value: num[i].confirm })
sum += num[i].confirm
}
myChart.setOption({
series: [{
data: virus
}]
})
}
})
window.addEventListener('resize', function() {
myChart.resize()
})
});
let res1, res2
$.ajax({
url: 'https://view.inews.qq.com/g2/getOnsInfo?name=disease_h5',
type: 'get',
dataType: 'jsonp',
})
.then((data) => {
var res = data.data || "";
res1 = JSON.parse(res).chinaTotal.confirm;
res2 = JSON.parse(res).chinaTotal.heal;
return $.ajax({
url: 'https://api.inews.qq.com/newsqa/v1/automation/modules/list?modules=FAutoGlobalStatis,FAutoContinentStatis,FAutoGlobalDailyList,FAutoCountryConfirmAdd',
type: 'get',
// data: {},
dataType: 'json',
})
})
.then((data) => {
// console.log(data)
let sum = data.data.FAutoGlobalStatis.confirm + res1
let cureSum = data.data.FAutoGlobalStatis.heal + res2
$(".no-hd li:first").text(sum)
$(".no-hd li:nth-child(2)").text(cureSum)
})
</script>
</head>
<body class="bod">
<header>
<div class="index"></div>
<h1>全球疫情情况展示</h1>
<div class="showTime" id="ST">
<p></p>
</div>
</header>
<div class="container mainbox">
<div class="row">
<!-- 左模块 -->
<div class="col-lg-3 col-md-5 a">
<div class="panel bl bar">
<h2>各洲累计确诊分布</h2>
<div class="chart"
style="-webkit-tap-highlight-color: transparent; user-select: none; position: relative;">
<div
style="position: relative; 318px; height: 250px; padding: 0px; margin: 0px; border- 0px;">
<canvas data-zr-dom-id="zr_0" width="397" height="312"
style="position: absolute; left: 0px; top: 0px; 318px; height: 250px; user-select: none; -webkit-tap-highlight-color: rgba(0, 0, 0, 0); padding: 0px; margin: 0px; border- 0px;"></canvas>
</div>
<div></div>
</div>
<div class="panelFooter"></div>
</div>
<div class="panel bl line">
<h2>全球疫情趋势</h2>
<div class="chart"
style="-webkit-tap-highlight-color: transparent; user-select: none; position: relative;">
<div
style="position: relative; 318px; height: 250px; padding: 0px; margin: 0px; border- 0px;">
<canvas data-zr-dom-id="zr_0" width="397" height="312"
style="position: absolute; left: 0px; top: 0px; 318px; height: 250px; user-select: none; -webkit-tap-highlight-color: rgba(0, 0, 0, 0); padding: 0px; margin: 0px; border- 0px;"></canvas>
</div>
</div>
<div class="panelFooter"></div>
</div>
</div>
<!-- 中间模块 -->
<div class="col-lg-6 order-lg-1 b order-md-2">
<!-- 上模块 -->
<div class="no">
<div class="no-hd">
<ul>
<li></li>
<li></li>
</ul>
</div>
<div class="no-bd">
<ul>
<li class="text-white">累计确诊人数</li>
<li class="text-white">累计治愈人数</li>
</ul>
</div>
</div>
<!-- 地图模块 -->
<div class="map">
<div class="chart" id="viewDiv"
style="-webkit-tap-highlight-color: transparent; user-select: none;">
<div
style="position: relative; 728px; height: 542px; padding: 0px; margin: 0px; border- 0px; cursor: default;">
<canvas data-zr-dom-id="zr_0" width="910" height="677"
style="position: absolute; left: 0px; top: 0px; 728px; height: 542px; user-select: none; -webkit-tap-highlight-color: rgba(0, 0, 0, 0); padding: 0px; margin: 0px; border- 0px;"></canvas>
</div>
<div
style="position: absolute; display: none; border-style: solid; white-space: nowrap; z-index: 9999999; transition: left 0.4s cubic-bezier(0.23, 1, 0.32, 1) 0s, top 0.4s cubic-bezier(0.23, 1, 0.32, 1) 0s; background-color: rgba(50, 50, 50, 0.7); border- 0px; border-color: rgb(51, 51, 51); border-radius: 4px; color: rgb(255, 255, 255); font: 14px/21px& amp; amp; amp; amp; amp; amp; amp; amp; amp; amp; amp; amp; amp; amp; amp; amp; amp; amp; amp; amp; amp; amp; amp; amp; amp; amp; amp; amp; amp; amp; amp; amp; amp; amp; amp; amp; amp; amp; amp; amp; amp; amp; amp; amp; amp; amp; amp; amp; amp; amp; amp; amp; amp; quot; Microsoft YaHei&amp; amp; amp; amp; amp; amp; amp; amp; amp; amp; amp; amp; amp; amp; amp; amp; amp; amp; amp; amp; amp; amp; amp; amp; amp; amp; amp; amp; amp; amp; amp; amp; amp; amp; amp; amp; amp; amp; amp; amp; amp; amp; amp; amp; amp; amp; amp; amp; amp; amp; amp; amp; amp; quot;; padding: 5px; left: 294px; top: 153px; pointer-events: none;">
累计确诊人数<br>
</div>
</div>
<div class="panelFooter"></div>
</div>
</div>
<!-- 右边模块 -->
<div class="col-lg-3 order-lg-2 c col-md-7 order-md-1">
<div class="panel bl bar1">
<h2>全球疫情模块</h2>
<div class="chart"
style="-webkit-tap-highlight-color: transparent; user-select: none; position: relative;">
<div
style="position: relative; 318px; height: 636px; padding: 0px; margin: 0px; border- 0px;">
<canvas data-zr-dom-id="zr_0" width="397" height="795"
style="position: absolute; left: 0px; top: 0px; 318px; height: 636px; user-select: none; -webkit-tap-highlight-color: rgba(0, 0, 0, 0); padding: 0px; margin: 0px; border- 0px;"></canvas>
</div>
</div>
</div>
</div>
</div>
</div>
</body>
</html>
预估时间记录日志:
| PSP2.1 | 阶段 | 时间 |
|---|---|---|
| Planning | 计划 | 1day |
| - Estimate | 估计这个任务需要多少时间 | 1week |
| Development | 开发 | 2day |
| - Analysis | 需求分析 | 1h |
| - Coding Standard | 代码规范 | 20min |
| - Design | 具体设计 | 2day |
| - Coding | 具体编码 | 2day |
| - Test | 测试 | 无 |
| - Count | 总计 | 6day |
实际时间记录日志:
| PSP2.1 | 阶段 | 时间 |
|---|---|---|
| Development | 开发 | 3day |
| - Analysis | 需求分析 | 30min |
| - Coding Standard | 代码规范 | 20min |
| - Design | 具体设计 | 2day |
| - Coding | 具体编码 | 1day |
| - Test | 测试 | 无 |
| - Count | 总计 | 3day |
总结:
本次作业是世界疫情地图的第二阶段,主要是web端和手机端的系统开发,总的来说,现在我的web差不多要搞定了,当然只是差不多而已,事实上我还差地图与表格的联动,表格方面,多条件查询包括了时间查询和地点查询并且界面样式采用了bootstrap来美化,并且表格用了datatables来封装,手机端方面现在还没开始做,但是我想只做个简单的查询系统,可以查询任一时间和任意地点的简单系统,总的来说,现在自己在学ssm框架以及今后要学vue前端框架,当然还有各种有用的插件,比如说bootstraptables以及bootstrap风格的ztree插件,这些都是我今后要学的目标。所以,今后继续努力,做完团队作业之后就开始学习其他新东西。