HAProxy的高级配置选项-Web服务器状态监测
作者:尹正杰
版权声明:原创作品,谢绝转载!否则将追究法律责任。
一.三种状态监测方式概述
1>.基于四层的传输端口做状态监测
  在haproxy的listen端配置:
    server web01 172.30.1.106:80 check port 9000 addr 172.30.1.107 inter 3s fall 3 rise 5 weight 1

  优点:
    只需要监控目标服务器的端口,比如在LNMP架构中,我们将haproxy请求打到nginx服务器上时,但与此同时我们要监控PHP进程是否正常。因此我们要单独监测一下PHP的端口,若端口不正常说明PHP服务存在问题,从而haproxy可以及时将该节点标记未不可用状态,让新的请求打到服务正常的节点上。

  缺点:
    有时候服务端口和进程都是存在的,但是就是不正常提供服务,尤其是Java程序很容易出现类似的案例,这个时候如果我们使用基于端口的监听方式明显就不太合适了。
2>. 基于指定URI 做状态监测
  优点:
    可以模拟客户端去访问服务端,如果响应状态码是正常的说明服务端处于正常工作状态,从而避免了基于端口监控的弊端。

  缺点:
    需要单独创建一个资源文件,占用磁盘空间,而且该文件在实际业务中并不会使用,该文件只是用来监测服务是否正常工作,因此建议将资源文件设置较小即可。
3>.基于指定URI的request请求头部内容做状态监测
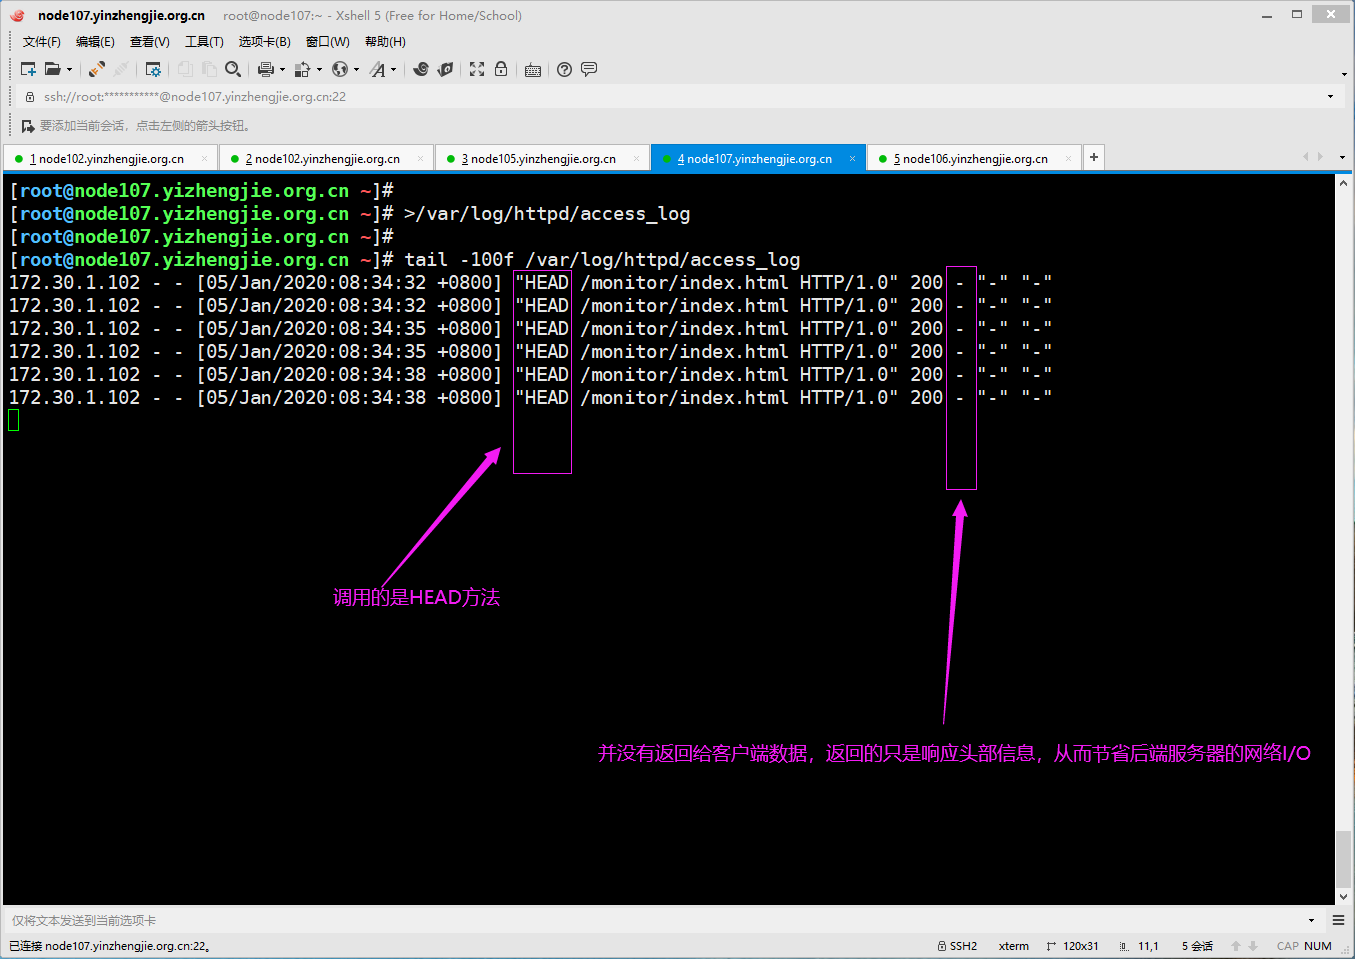
  优点:
    和上面所说的"基于指定URI做状态监测"原理一样,只不过它做了一个优化操作,就是不要消息体(body)部分,只返回给haproxy响应头部(head)信息即可,从而节省了后端web服务器的网络I/O。

  缺点:
    同上面所说的"基于指定URI做状态监测",不过相对于以上说的两种监测方案,这种监测我还是推荐在生产环境中使用的。
二.基于四层的传输端口做状态监测实战案例
1>.编辑haproxy的配置文件
[root@node102.yinzhengjie.org.cn ~]# cat /etc/haproxy/haproxy.cfg
global
    maxconn 100000
    chroot /yinzhengjie/softwares/haproxy
    stats socket /yinzhengjie/softwares/haproxy/haproxy.sock mode 600 level admin
    user haproxy
    group haproxy
    daemon
    nbproc 2
    cpu-map 1 0
    cpu-map 2 1
    nbthread 2
    pidfile /yinzhengjie/softwares/haproxy/haproxy.pid
    log 127.0.0.1 local5 info

defaults
    option http-keep-alive
    option  forwardfor
    option redispatch
    option abortonclose
    maxconn 100000
    mode http
    timeout connect 300000ms
    timeout client  300000ms
    timeout server  300000ms

listen status_page
    bind 172.30.1.102:8888
    stats enable
    stats uri /haproxy-status
    stats auth    admin:yinzhengjie
    stats realm "Welcome to the haproxy load balancer status page of YinZhengjie"
    stats hide-version
    stats admin if TRUE
    stats refresh 5s

listen WEB_PORT_80
    bind 172.30.1.102:80
    balance roundrobin
    cookie HAPROXY-COOKIE insert indirect nocache
    #我在web01节点上监测172.30.1.107的9000端口是否存在,若存在说明服务正常,若不存在说明服务不正常
    #为了看到试验效果,我只在172.30.1.107安装了httpd服务,即并没有启动9000端口,因此状态页面应该可以看到该服务是异常的
    server web01 172.30.1.106:80  cookie httpd-106 check port 9000 addr 172.30.1.107 inter 3000 fall 3 rise 5
    server web02 172.30.1.107:80  cookie httpd-107 check inter 3000 fall 3 rise 5
    server web03 172.30.1.108:80  cookie httpd-107 check inter 3000 fall 3 rise 5 backup
[root@node102.yinzhengjie.org.cn ~]#
[root@node102.yinzhengjie.org.cn ~]# systemctl restart haproxy              #别忘记重启服务使得配置生效哟~
[root@node102.yinzhengjie.org.cn ~]#
[root@node102.yinzhengjie.org.cn ~]#
2>.查看haproxy状态页

三.基于指定URI做状态监测实战案例
1>.在后端的web浏览器创建监控资源
[root@node107.yizhengjie.org.cn ~]# mkdir -pv /var/www/html/monitor
mkdir: created directory ‘/var/www/html/monitor’
[root@node107.yizhengjie.org.cn ~]#
[root@node107.yizhengjie.org.cn ~]# echo "Apache httpd is ok" > /var/www/html/monitor/index.html
[root@node107.yizhengjie.org.cn ~]#
[root@node107.yizhengjie.org.cn ~]# cat /var/www/html/monitor/index.html
Apache httpd is ok
[root@node107.yizhengjie.org.cn ~]#
2>.在haproxy节点访问后端服务的监控测试页面
[root@node102.yinzhengjie.org.cn ~]# curl -I http://node107.yinzhengjie.org.cn/monitor/index.html      #node107.yinzhengjie.org.cn节点可以获得正常的头部信息
HTTP/1.1 200 OK
Date: Sun, 05 Jan 2020 00:11:55 GMT
Server: Apache/2.4.6 (CentOS)
Last-Modified: Sun, 05 Jan 2020 00:09:52 GMT
ETag: "13-59b595caccb40"
Accept-Ranges: bytes
Content-Length: 19
Content-Type: text/html; charset=UTF-8

[root@node102.yinzhengjie.org.cn ~]#
[root@node102.yinzhengjie.org.cn ~]# curl http://node107.yinzhengjie.org.cn/monitor/index.html        #"node107.yinzhengjie.org.cn"节点可以访问到监控页面
Apache httpd is ok
[root@node102.yinzhengjie.org.cn ~]#
[root@node102.yinzhengjie.org.cn ~]# curl -I http://node106.yinzhengjie.org.cn/monitor/index.html      #"node106.yinzhengjie.org.cn"节点访问不到监控页面,因为咱们故意没有创建。
HTTP/1.1 404 Not Found
Date: Sun, 05 Jan 2020 00:12:09 GMT
Server: Apache/2.4.6 (CentOS)
Content-Type: text/html; charset=iso-8859-1

[root@node102.yinzhengjie.org.cn ~]#
[root@node102.yinzhengjie.org.cn ~]# curl -I http://node108.yinzhengjie.org.cn/monitor/index.html      #同上,"node108.yinzhengjie.org.cn"节点也访问不到监控页面。
HTTP/1.1 404 Not Found
Date: Sun, 05 Jan 2020 00:12:16 GMT
Server: Apache/2.4.6 (CentOS)
Content-Type: text/html; charset=iso-8859-1

[root@node102.yinzhengjie.org.cn ~]#
[root@node102.yinzhengjie.org.cn ~]#
3>.编辑haproxy的配置文件
[root@node102.yinzhengjie.org.cn ~]# cat /etc/haproxy/haproxy.cfg
global
    maxconn 100000
    chroot /yinzhengjie/softwares/haproxy
    stats socket /yinzhengjie/softwares/haproxy/haproxy.sock mode 600 level admin
    user haproxy
    group haproxy
    daemon
    nbproc 2
    cpu-map 1 0
    cpu-map 2 1
    nbthread 2
    pidfile /yinzhengjie/softwares/haproxy/haproxy.pid
    log 127.0.0.1 local5 info

defaults
    option http-keep-alive
    option  forwardfor
    option redispatch
    option abortonclose
    maxconn 100000
    mode http
    timeout connect 300000ms
    timeout client  300000ms
    timeout server  300000ms

listen status_page
    bind 172.30.1.102:8888
    stats enable
    stats uri /haproxy-status
    stats auth    admin:yinzhengjie
    stats realm "Welcome to the haproxy load balancer status page of YinZhengjie"
    stats hide-version
    stats admin if TRUE
    stats refresh 5s

listen WEB_PORT_80
    bind 172.30.1.102:80
    balance roundrobin
    #使用GET方法基于指定URL监控,使用的HTTP协议为HTTP/1.0(如果是基于yum方式安装的Apache httpd后端服务器不要写"HTTP 1.1"哟,最好使用"HTTP 1.0")
    option httpchk GET /monitor/index.html HTTP/1.0
    cookie HAPROXY-COOKIE insert indirect nocache
    server web01 172.30.1.106:80  cookie httpd-106 check inter 3000 fall 3 rise 5
    server web02 172.30.1.107:80  cookie httpd-107 check inter 3000 fall 3 rise 5
    server web03 172.30.1.108:80  cookie httpd-107 check inter 3000 fall 3 rise 5 backup
[root@node102.yinzhengjie.org.cn ~]#
[root@node102.yinzhengjie.org.cn ~]# systemctl restart haproxy
[root@node102.yinzhengjie.org.cn ~]#
[root@node102.yinzhengjie.org.cn ~]#
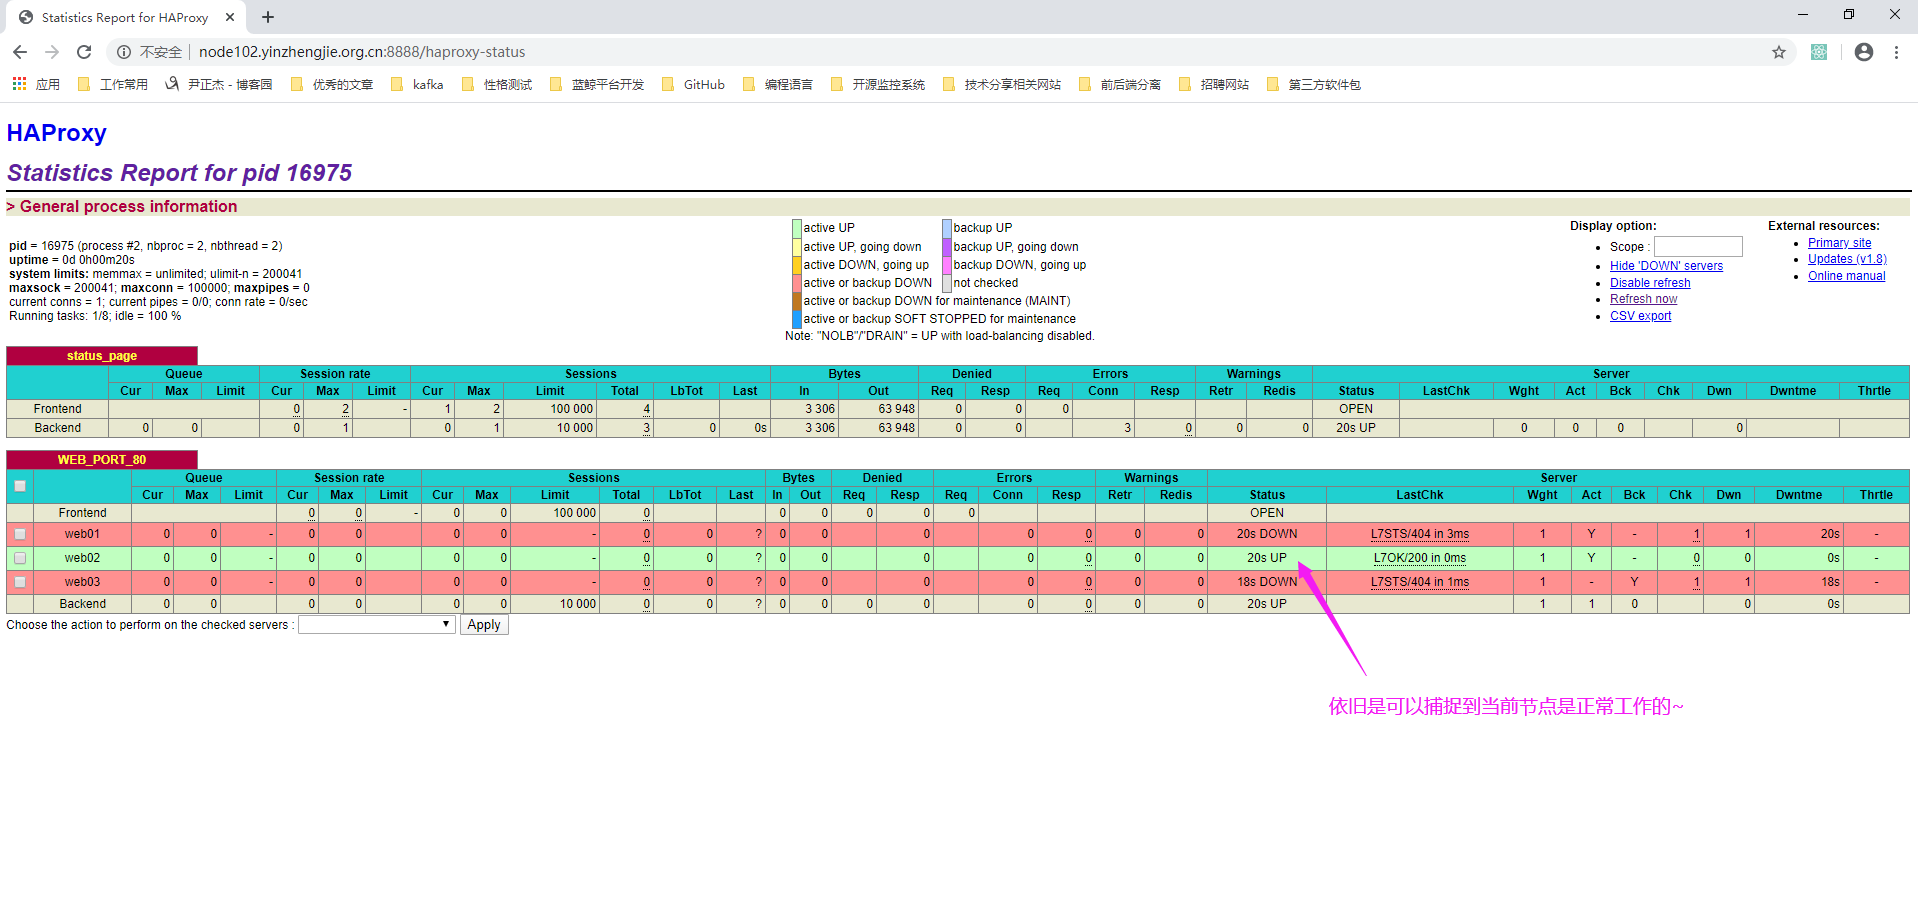
4>.查看haproxy状态页

5>.查看"node107.yinzhengjie.org.cn"的apache httpd的日志,如下图所示。

四.基于指定URI的request请求头部内容做状态监测案例
1>.编辑haproxy的配置文件
[root@node102.yinzhengjie.org.cn ~]# cat /etc/haproxy/haproxy.cfg
global
    maxconn 100000
    chroot /yinzhengjie/softwares/haproxy
    stats socket /yinzhengjie/softwares/haproxy/haproxy.sock mode 600 level admin
    user haproxy
    group haproxy
    daemon
    nbproc 2
    cpu-map 1 0
    cpu-map 2 1
    nbthread 2
    pidfile /yinzhengjie/softwares/haproxy/haproxy.pid
    log 127.0.0.1 local5 info

defaults
    option http-keep-alive
    option  forwardfor
    option redispatch
    option abortonclose
    maxconn 100000
    mode http
    timeout connect 300000ms
    timeout client  300000ms
    timeout server  300000ms

listen status_page
    bind 172.30.1.102:8888
    stats enable
    stats uri /haproxy-status
    stats auth    admin:yinzhengjie
    stats realm "Welcome to the haproxy load balancer status page of YinZhengjie"
    stats hide-version
    stats admin if TRUE
    stats refresh 5s

listen WEB_PORT_80
    bind 172.30.1.102:80
    balance roundrobin
    #通过request获取的头部信息进行匹配进行健康检测
    option httpchk HEAD /monitor/index.html HTTP/1.0
Host: 172.30.1.102
    cookie HAPROXY-COOKIE insert indirect nocache
    server web01 172.30.1.106:80  cookie httpd-106 check inter 3000 fall 3 rise 5
    server web02 172.30.1.107:80  cookie httpd-107 check inter 3000 fall 3 rise 5
    server web03 172.30.1.108:80  cookie httpd-107 check inter 3000 fall 3 rise 5 backup
[root@node102.yinzhengjie.org.cn ~]#
[root@node102.yinzhengjie.org.cn ~]# systemctl restart haproxy
[root@node102.yinzhengjie.org.cn ~]#
2>.查看haproxy状态页
3>.查看"node107.yinzhengjie.org.cn"的apache httpd的日志,如下图所示。