==============================================================================================
2022/8/31 09:56更新
mAP@0.5:mean Average Precision(IoU=0.5)(mAP@0.5与mAP@0.5:0.95的含义,YOLO_流星落,的博客-程序员秘密_map0.5:0.95 - 程序员秘密 (i4k.xyz))
即将IoU设为0.5时,计算每一类的所有图片的AP,然后所有类别求平均,即mAP

如图所示,AP50,AP60,AP70……等等指的是取detector的IoU阈值大于0.5,大于0.6,大于0.7……等等。数值越高,即阈值越大,精度越低。
表示在不同IoU阈值(从0.5到0.95,步长0.05)(0.5、0.55、0.6、0.65、0.7、0.75、0.8、0.85、0.9、0.95)上的平均mAP。
如何衡量目标检测算法的优劣
目标检测(object detection)问题相对于一般AI分类问题更加复杂,不仅检测出目标,输出目标的类别,还要定位出目标的位置。分类问题中的简单accuray指标已经不能反映出目标检测问题结果的准确度,而mAP (Mean Average Precision)就是被用来衡量目标检测算法优劣的常用指标。
要理解什么是mAP,需要先澄清什么是Precision(查准率)和Recall(查全率)。
定义
查准率和查全率是在信息检索、Web搜索等应用中经常出现的性能度量指标,在机器学习中,也可以用来度量“预测结果中有多少比例是用户感兴趣的”。对于二分类问题,可将样例根据其真实类别与预测类别的组合划分为:
TP、TN、FP、FN
TP (True Positive): 真正例。Positive指预测输出为正,True代表预测正确。
TN (True Negative): 真反例。预测输出为负,而且预测正确。
FP (False Positive): 假正例。预测输出为正,但是预测错误。
FN (False Negative): 假反例。预测输出为负,但是预测错误。
Precision(查准率): 所有预测为正例的结果中,预测正确的比率。
Recall (查全率):所有正例中被正确预测的比率。
如何计算:
目标检测问题中,算法通常输出一个预测框(bounding box)来标识检出目标的位置,要衡量这个预测框与目标的实际位置(ground truth)的准确度,可以使用IoU指标。
交并比IoU(Intersection over union)
交并比IoU衡量的是两个区域的重叠程度,是两个区域重叠部分面积占二者总面积(重叠部分只计算一次)的比例。
目标检测中IoU就是预测框与实际框的交集除以并集。
我们可以设置一个阈值(threshold),通常是0.5,预测结果可以分为:
如果IoU >= 0.5
如果预测类别也正确,认为是一个好的预测,分类为TP
如果预测类别错误,认为是一个坏的预测,分类为FP
如果IoU < 0.5, 认为是一个坏的预测,分类为FP
如果一个目标出现在图像中,但是算法未检出,分类为FN
TN(图像上所有不包含实际框和检测框的部分)通常计算中用不到。
查全率和查准率通常是一对矛盾的度量,一般来说,查准率高时,查全率往往偏低;而查全率高时,查准率往往偏低。
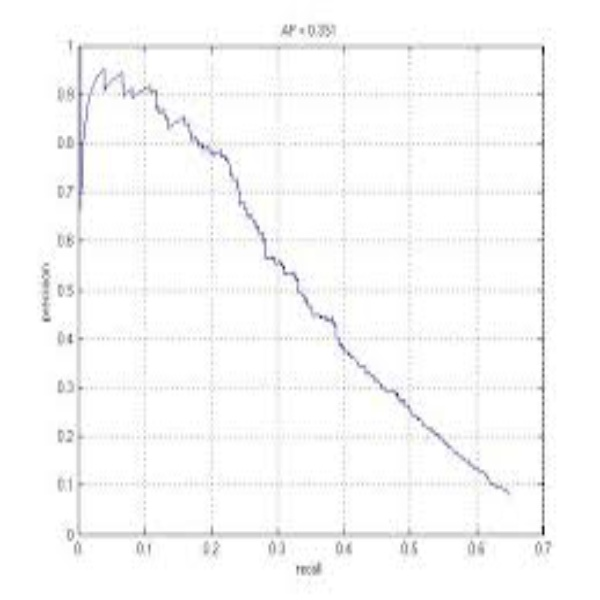
我们如果把所有预测结果对样例进行排序,排在前面的是“最可能”的正例样本,以查准率为纵轴、查全率为横轴作图,得到一条”P-R曲线”。
AP
AP(average precision 平均精度):AP是计算单类别的模型平均准确度。对于目标检测任务,每一个类都可以计算出其Precision和Recall,每个类都可以得到一条P-R曲线,曲线下的面积就是AP的值。如果一个算法的AP值较大,也就是P-R曲线下的面积比较大,可以认为此算法查准率和查全率整体上相对
mAP
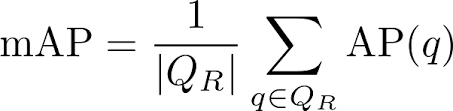
mAP(mean of Average Precision) : 对所有类别的AP值求平均值。
Pascal VOC(VOC2007 & VOC2012)是评测目标检测算法的常用数据集,VOC数据集使用一个固定的IoU阈值0.5来计算AP值。 但是在2014年之后,MS-COCO(Microsoft Common Objects)数据集逐渐兴起。 在COCO数据集中,更关注预测框位置的准确性,AP值是针对多个IoU阈值的AP平均值,具体的就是在0.5 和0.95之间取10个IoU阈值(0.5、0.55、0.6 ..... 0.9、0.95)。所以VOC数据集中mAP通常标记为mAP @ IoU=0.5, mAP@0.5 或者 mAP_50,在COCO 数据集中册标记为 mAP @ IoU=0.5:0.05:0.95, mAP @ IoU=0.5:0.95 或者 mAP@[0.5:0.95].
==============================================================================================
==============================================================================================
2022/8/31 09:54更新
mAP@0.5:mean Average Precision(IoU=0.5)(https://blog.csdn.net/ruyingcai666666/article/details/109670567)
即将IoU设为0.5时,计算每一类的所有图片的AP,然后所有类别求平均,即mAP
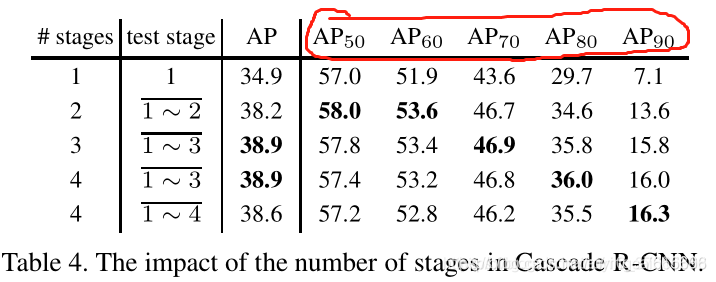
如图所示,AP50,AP60,AP70……等等指的是取detector的IoU阈值大于0.5,大于0.6,大于0.7……等等。数值越高,即阈值越大,精度越低。
mAP@.5:.95(mAP@[.5:.95])
表示在不同IoU阈值(从0.5到0.95,步长0.05)(0.5、0.55、0.6、0.65、0.7、0.75、0.8、0.85、0.9、0.95)上的平均mAP。
=================================================================================================
深度学习: mAP (Mean Average Precision)_JNingWei的博客-CSDN博客_meanap
完整学习目标检测中的 Recalls, Precisions, AP, mAP 算法 Part1 - 知乎 (zhihu.com)
深度学习-目标检测中的mAP计算_mb5fdb128f2dba9的技术博客_51CTO博客
mAP?:mAP (mean Average Precision) for Object Detection | by Jonathan Hui | Medium
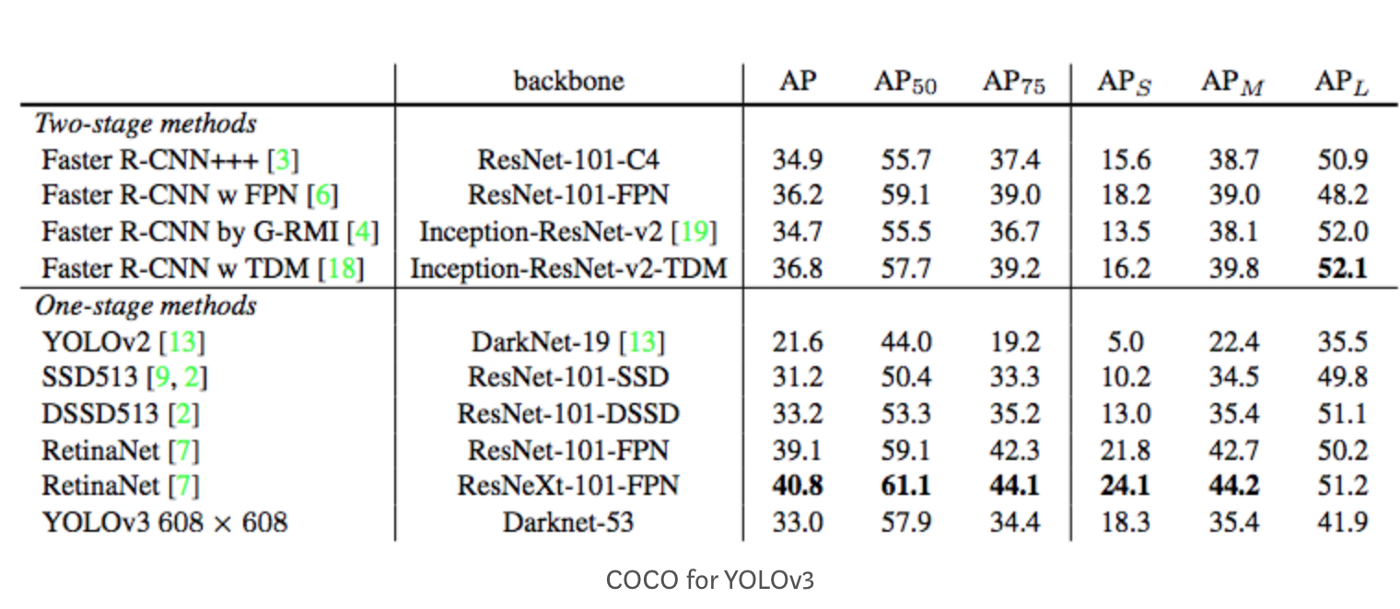
In the figure above, AP@.75 means the AP with IoU=0.75.
mAP (mean average precision) is the average of AP. In some context, we compute the AP for each class and average them. But in some context, they mean the same thing. For example, under the COCO context, there is no difference between AP and mAP. Here is the direct quote from COCO:
AP is averaged over all categories. Traditionally, this is called “mean average precision” (mAP). We make no distinction between AP and mAP (and likewise AR and mAR) and assume the difference is clear from context.
mAP 概念
P
precision,即 准确率 。
R
recall,即 召回率 。
PR曲线
即 以 precision 和 recall 作为 纵、横轴坐标 的二维曲线。
一般来说,precision 和 recall 是 鱼与熊掌 的关系。下图即是 PR曲线:
AP值
Average Precision,即 平均准确率 。
如何衡量一个模型的性能,单纯用 precision 和 recall 都不科学。于是人们想到,哎嘛为何不把 PR曲线下的面积 当做衡量尺度呢?于是就有了 AP值 这一概念。这里的 average,等于是对 precision 进行 取平均 。
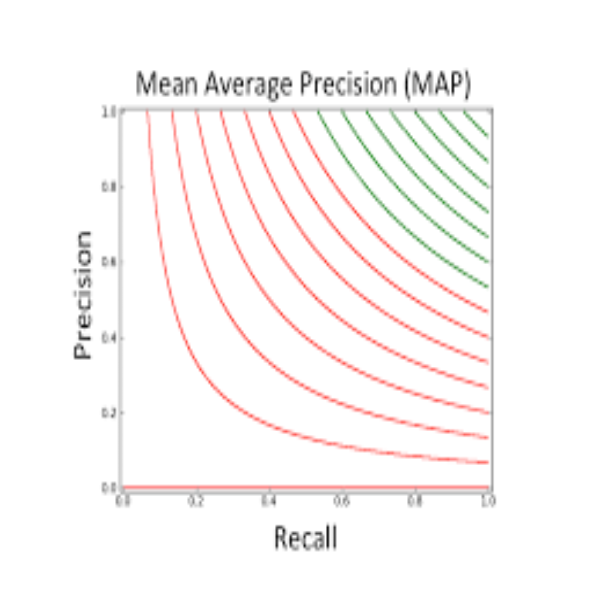
mAP值
Mean Average Precision,即 平均AP值 。
是对多个验证集个体求平均AP值 。如下图:
mAP 计算
公式
Code
def compute_ap(gt_boxes, gt_class_ids,
pred_boxes, pred_class_ids, pred_scores,
iou_threshold=0.5):
"""Compute Average Precision at a set IoU threshold (default 0.5).

Returns:
mAP: Mean Average Precision
precisions: List of precisions at different class score thresholds.
recalls: List of recall values at different class score thresholds.
overlaps: [pred_boxes, gt_boxes] IoU overlaps.
"""
# Trim zero padding and sort predictions by score from high to low
gt_boxes = trim_zeros(gt_boxes)
pred_boxes = trim_zeros(pred_boxes)
pred_scores = pred_scores[:pred_boxes.shape[0]]
indices = np.argsort(pred_scores)[::-1]
pred_boxes = pred_boxes[indices]
pred_class_ids = pred_class_ids[indices]
pred_scores = pred_scores[indices]

# Compute IoU overlaps [pred_boxes, gt_boxes]
overlaps = compute_overlaps(pred_boxes, gt_boxes)

# Loop through ground truth boxes and find matching predictions
match_count = 0
pred_match = np.zeros([pred_boxes.shape[0]])
gt_match = np.zeros([gt_boxes.shape[0]])
for i in range(len(pred_boxes)):
# Find best matching ground truth box
sorted_ixs = np.argsort(overlaps[i])[::-1]
for j in sorted_ixs:
# If ground truth box is already matched, go to next one
if gt_match[j] == 1:
continue
# If we reach IoU smaller than the threshold, end the loop
iou = overlaps[i, j]
if iou < iou_threshold:
break
# Do we have a match?
if pred_class_ids[i] == gt_class_ids[j]:
match_count += 1
gt_match[j] = 1
pred_match[i] = 1
break

# Compute precision and recall at each prediction box step
precisions = np.cumsum(pred_match) / (np.arange(len(pred_match)) + 1)
recalls = np.cumsum(pred_match).astype(np.float32) / len(gt_match)

# Pad with start and end values to simplify the math
precisions = np.concatenate([[0], precisions, [0]])
recalls = np.concatenate([[0], recalls, [1]])

# Ensure precision values decrease but don't increase. This way, the
# precision value at each recall threshold is the maximum it can be
# for all following recall thresholds, as specified by the VOC paper.
for i in range(len(precisions) - 2, -1, -1):
precisions[i] = np.maximum(precisions[i], precisions[i + 1])

# Compute mean AP over recall range
indices = np.where(recalls[:-1] != recalls[1:])[0] + 1
mAP = np.sum((recalls[indices] - recalls[indices - 1]) *
precisions[indices])

return mAP, precisions, recalls, overlaps
[1]完整学习目标检测中的 Recalls, Precisions, AP, mAP 算法 Part1
[2]完整学习目标检测中的 Recalls, Precisions, AP, mAP 算法 Part2