需要添加引用 “Microsoft Office Web Components 11.0 ”,在代码页添加 “using Microsoft.Office.Interop.Owc11;”
成功添加这个引用需要安装office 2003,装了office 2007 不行,或者直接去微软网站下载owc1.exe 吧(安装这个之后应该可以不用安装office了吧?没试过,但是如果安装了office 2007 的话下载安装owc11.exe是可以的)
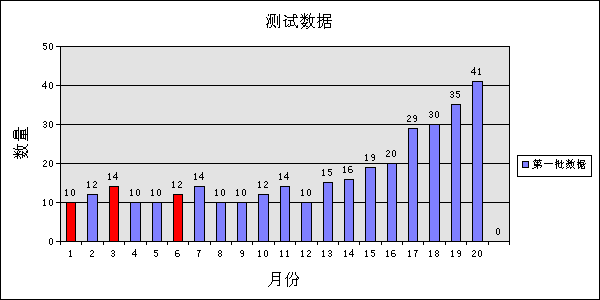
先看图

代码
 柱状图一
柱状图一
using System;
using System.Collections.Generic;
using System.Linq;
using System.Web;
using System.Web.UI;
using System.Web.UI.WebControls;
using Microsoft.Office.Interop.Owc11;
using System.Data.SqlClient;
using System.Data;
public partial class _Default : System.Web.UI.Page
{
protected void Page_Load(object sender, EventArgs e)
{
string strConnectionString = "server = (local);DataBase=blog;uID=a;password=a;";
string strSQL = "select TMonth,TCount from TestChart";
SqlConnection myconn = new SqlConnection(strConnectionString);
myconn.Open();
SqlDataAdapter sda = new SqlDataAdapter(strSQL, myconn);
DataSet DS = new DataSet();
sda.Fill(DS);
int dataCount = DS.Tables[0].Rows.Count;
//月
string[] Mon = new string[dataCount];
//Data
string[] MonData = new string[dataCount];
for (int i = 0; i < dataCount; i++)
{
Mon[i] = DS.Tables[0].Rows[i]["TMonth"].ToString();
MonData[i] = DS.Tables[0].Rows[i]["TCount"].ToString();
}
//为X轴指定特定字符串,以便显示数据
string strXData = string.Empty;
foreach (string strData in Mon)
{
strXData += strData + "\t";
}
//为y轴指定特定的字符串,以便于x轴对应
string strYData= string.Empty;
foreach (string value in MonData)
{
strYData += value + "\t ";
}
//ChartSpace对象:图形容器对象,也是顶层对象。如果要运用OWC绘制图形,至少要创建一个ChartSpace对象。
//所谓容器,就是说ChartSpace对象中可以包含多个图形对象,最多16个。
//创建chartSpace对象来放置图表
ChartSpace layspace = new ChartSpace();
//在chartSpace中添加图表
ChChart InsertChart = layspace.Charts.Add(0);
//ChChart对象、ChCharts集合、ChCharts.Add()方法:
//ChChart是图形对象。一个柱状图、饼状图、散点图等均为一个图形对象,多个图形对象构成ChCharts集合。
//ChartSpace对象就包含一个ChCharts集合,这些ChChart之间互相叠加,比如簇状条形图就是多个单柱状图地叠加,//
//圆环套圆环图就是两个单圆环图地叠加。通过ChCharts.Add()方法增加一个图形。
//指定绘制图表的类型。
//类型可以通过OWC.ChartChartTypeEnum枚举值得到
//折线图
//InsertChart.Type = ChartChartTypeEnum.chChartTypeLine;
//面积图
//InsertChart.Type = ChartChartTypeEnum.chChartTypeArea;
//条形图
//InsertChart.Type = ChartChartTypeEnum.chChartTypeBarClustered;
//饼状图
//InsertChart.Type = ChartChartTypeEnum.chChartTypePie;
//柱形图
InsertChart.Type = ChartChartTypeEnum.chChartTypeColumnClustered;
//ChSeries对象、ChSeriesCollection集合、ChSeriesCollection.Add()方法:
//帮助中说:一个ChSeries对象表示图中地一个系列。实际上,你可以这样理解,当图形容器中包含多个图形时,
//一个ChSeries对象就表示在这里面地一个图形,可以通过ChSeriesCollection集合,可以运用数组地方式访问各个ChSeries,
//比如ChSeriesCollection[0]表示第一个图形。运用ChSeriesCollection.Add()方法在当前容器中新增一个图形。
//Point属性和Points集合:一个Point代表图形中地一个部分,比如柱状图地一条柱,饼状图地一个扇区等。
// ChChart 对象提供Points集合,可以运用数组地形式访问各个Point,比如Points[0]表示第1个部分。
//Interior属性:代表一 个形状地内部空间。
//比如,ChartSpace对象地Interior属性代表图形容器内、图形外地空间,一个扇区Interior属性
//表示该扇区地内部空间。该属性在设置图形各个部分地颜色时起到重要作用。窃以为,以上对象和属性地理解、运用相当关
//键,顺着它们找下去,标题、图例、数据标签、字体等重要地特性特点都能顺利找到
//指定图表是否需要图例标注
InsertChart.HasLegend = true;
//显示标题
InsertChart.HasTitle = true;
//设置标题内容
InsertChart.Title.Caption = "测试数据";
//饼状图没有x、y轴,当为饼状图时此段代码不能有
//为x、y轴添加图例说明
InsertChart.Axes[0].HasTitle = true;
InsertChart.Axes[0].Title.Caption = "月份";
InsertChart.Axes[1].HasTitle = true;
//下面这行代码去掉屏蔽一看就明白什么意思了
//InsertChart.Axes[1].Scaling.SplitMinimum = 2;
InsertChart.Axes[1].Title.Caption = "数量";
//添加一个系列
InsertChart.SeriesCollection.Add(0);
//给出系列的名字
InsertChart.SeriesCollection[0].SetData(ChartDimensionsEnum.chDimSeriesNames,
+(int)ChartSpecialDataSourcesEnum.chDataLiteral,"第一批数据");
//给定分类 数据格式为: 数据\t数据\t数据\t数据 用“\t”界定边界,而且不能重复。重复的值显示一个
InsertChart.SeriesCollection[0].SetData(ChartDimensionsEnum.chDimCategories,
+(int)ChartSpecialDataSourcesEnum.chDataLiteral, strXData);
//给定值
InsertChart.SeriesCollection[0].SetData(ChartDimensionsEnum.chDimValues,
+(int)ChartSpecialDataSourcesEnum.chDataLiteral,strYData);
//将柱状图地第一条柱设置为红色
//Point:代表图中地一部分,比如柱图地一条柱,饼图地一个扇区
//Interior:表示指定对象地内部
//增加数据值标签
InsertChart.SeriesCollection[0].DataLabelsCollection.Add();
//显示数据值
InsertChart.SeriesCollection[0].DataLabelsCollection[0].HasValue = true;
InsertChart.SeriesCollection[0].Points[0].Interior.Color = "Red";
InsertChart.SeriesCollection[0].Points[2].Interior.Color = "Red";
InsertChart.SeriesCollection[0].Points[5].Interior.Color = "Red";
//输出
string imgname = DateTime.Now.Date.ToShortDateString() + "-" + DateTime.Now.Hour.ToString() + "-" +
DateTime.Now.Minute.ToString() + "-" + DateTime.Now.Second.ToString() + "-" + DateTime.Now.Millisecond.ToString() + ".gif";
string strAbso = (Server.MapPath("."))+"\\" + imgname;
layspace.ExportPicture( strAbso,"gif",600,300);
//创建gif文件的相对路径
//string strRelativePath = "showdata.gif";
string strRelativePath = imgname;
pic.InnerHtml = "<img src='"+ strRelativePath + "'>";
}
}
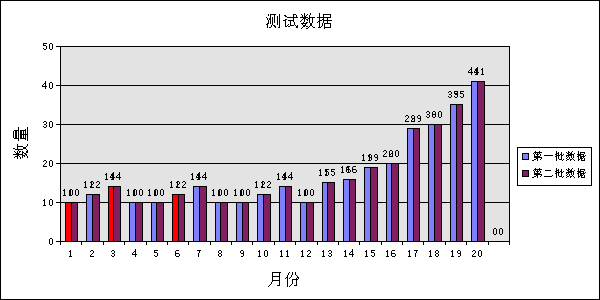
在上述代码中添加第二个系列(在上述代码第136行添加一下代码)
 代码
代码
效果图:

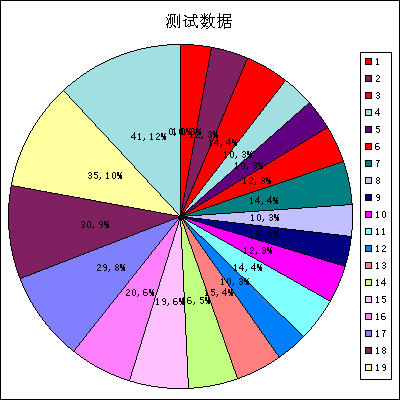
在试试饼状图

代码
 饼状图
饼状图
注意的是饼状图中没有x、y轴;且只显示一个系列的数据(我添加了第二个系列数据时没显示)
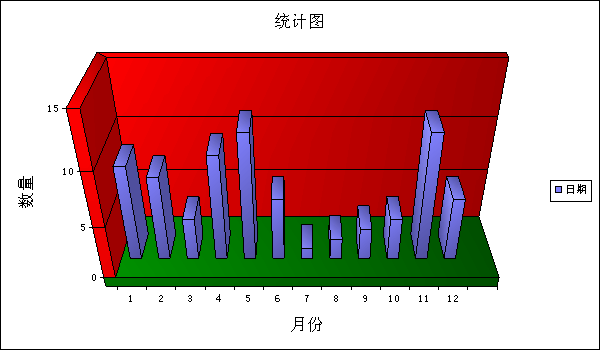
在加段代码,柱状3D图 先看效果:
很漂亮吧,来看代码
 柱状3D图
柱状3D图