一:背景
当正在运行的golang程序消耗预期之外的内存和时间,我们这个时候就需要去弄明白,到底是是我们的代码哪个地方消耗了这些内存及相应时间。但此时编译好的golang程序对我们而言是黑盒,如果去分析具体的内存及时间使用情况?这个时候我们可以去了解和使用pprof来分析golang进程的内存使用。
二:实战
2.1.环境搭建
下载安装golang,需要进到pod容器中(或者也可以将这些打到基础镜像中)
$ wget https://go.dev/dl/go1.15.15.linux-amd64.tar.gz
$ tar -C /usr/local -xzf go1.4.linux-amd64.tar.gz
# 添加到环境变量中
$ export PATH=$PATH:/usr/local/go/bin
安装生成svg图的依赖
$ yum install graphviz -y
2.2.修改和添加业务代码
在相关业务服务代码main中添加以下代码
// pprof 的init函数会将pprof里的一些handler注册到http.DefaultServeMux上
// 当不使用http.DefaultServeMux来提供http api时,可以查阅其init函数,自己注册handler
import _ "net/http/pprof"

go func() {
    http.ListenAndServe("0.0.0.0:9090", nil)
}()
修改完成后编译二进制,并运行对应二进制。
2.3.通过 Web 界面查看
查看当前总览:访问 http://127.0.0.1:9090/debug/pprof/,可以查看到如下图相关信息。
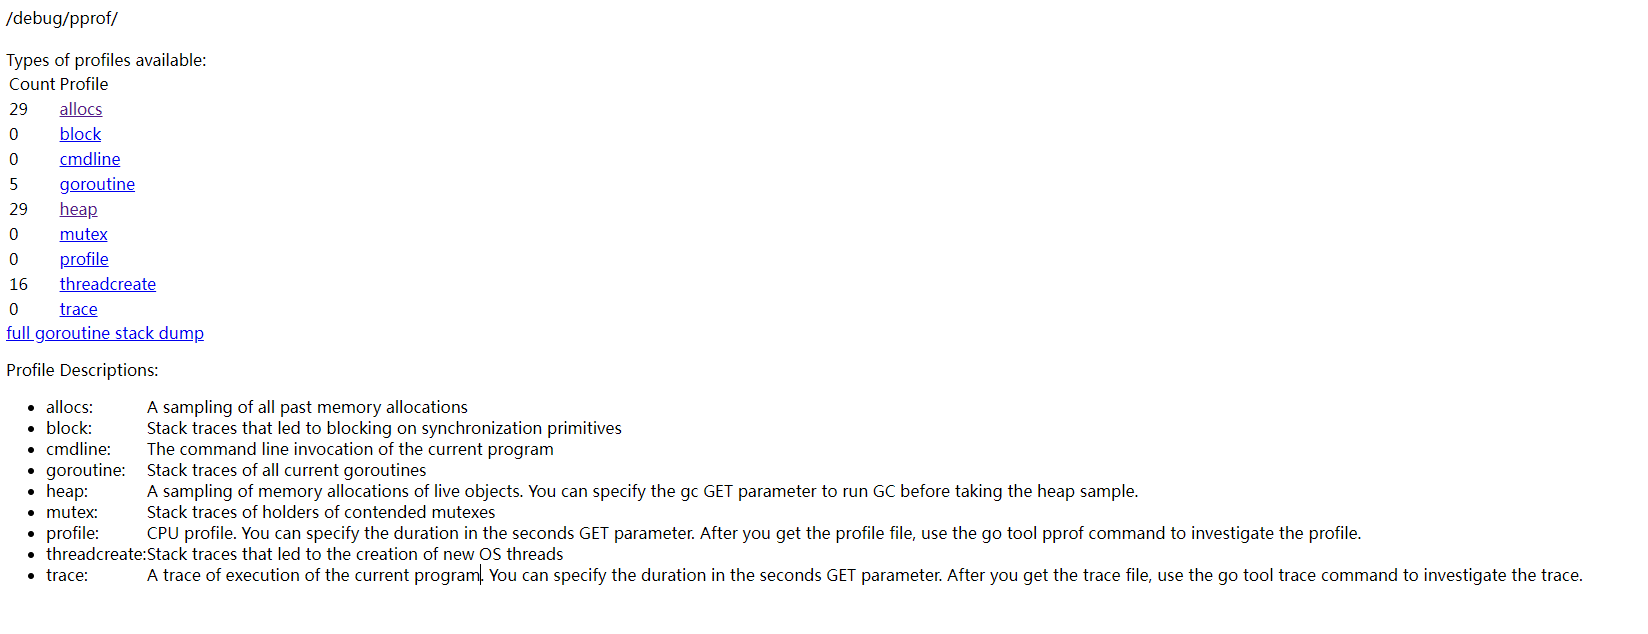
可以直接点击上面的链接,进入子页面,查看相关的汇总信息。
2.4.go tool分析法
2.4.1.内存分析
我们可以采用go tool pprof -inuse_space http://127.0.0.1:9090/debug/pprof/heap命令连接到进程中 查看正在使用的一些内存相关信息,此时我们得到一个可以交互的命令行。
我们可以看数据top10来查看正在使用的对象较多的10个函数入口。通常用来检测有没有不符合预期的内存 对象引用。
# go tool pprof -inuse_space http://127.0.0.1:9090/debug/pprof/heap
Fetching profile over HTTP from http://127.0.0.1:9090/debug/pprof/heap
Saved profile in /root/pprof/pprof.yaohong.alloc_objects.alloc_space.inuse_objects.inuse_space.003.pb.gz
File: test_exporter
Type: inuse_space
Time: Dec 15, 2021 at 1:05pm (CST)
Entering interactive mode (type "help" for commands, "o" for options)
(pprof) top10
Showing nodes accounting for 512.69kB, 100% of 512.69kB total
Showing top 10 nodes out of 12
      flat  flat%   sum%        cum   cum%
  512.69kB   100%   100%   512.69kB   100%  crypto/x509.parseCertificate
         0     0%   100%   512.69kB   100%  crypto/x509.(*CertPool).AppendCertsFromPEM
         0     0%   100%   512.69kB   100%  crypto/x509.ParseCertificate
         0     0%   100%   512.69kB   100%  crypto/x509.SystemCertPool
         0     0%   100%   512.69kB   100%  crypto/x509.initSystemRoots
         0     0%   100%   512.69kB   100%  crypto/x509.loadSystemRoots
         0     0%   100%   512.69kB   100%  crypto/x509.systemRootsPool (inline)
         0     0%   100%   512.69kB   100%  harbor_exporter/collector.New
         0     0%   100%   512.69kB   100%  main.main
         0     0%   100%   512.69kB   100%  runtime.main
(pprof)
然后我们在用go tool pprof -alloc_space http://127.0.0.1:9090/debug/pprof/heap命令链接程序来查看 内存对象分配的相关情况。然后输入top来查看累积分配内存较多的一些函数调用:
# go tool pprof -alloc_space http://127.0.0.1:9090/debug/pprof/heap
Fetching profile over HTTP from http://127.0.0.1:9090/debug/pprof/heap
Saved profile in /root/pprof/pprof.yaohong.alloc_objects.alloc_space.inuse_objects.inuse_space.004.pb.gz
File: test_exporter
Type: alloc_space
Time: Dec 15, 2021 at 1:08pm (CST)
Entering interactive mode (type "help" for commands, "o" for options)
(pprof) top
Showing nodes accounting for 29601.22kB, 86.52% of 34211.94kB total
Showing top 10 nodes out of 95
      flat  flat%   sum%        cum   cum%
 9272.51kB 27.10% 27.10%  9272.51kB 27.10%  os.(*File).readdirnames
 3610.34kB 10.55% 37.66%  3610.34kB 10.55%  compress/flate.NewWriter
 3587.75kB 10.49% 48.14%  3587.75kB 10.49%  bytes.makeSlice
 3584.50kB 10.48% 58.62%  5120.55kB 14.97%  os.Readlink
 2560.13kB  7.48% 66.10%  2560.13kB  7.48%  strings.(*Builder).grow (inline)
 2368.55kB  6.92% 73.03%  2368.55kB  6.92%  runtime/pprof.StartCPUProfile
 1542.01kB  4.51% 77.53%  1542.01kB  4.51%  bufio.NewReaderSize (inline)
 1536.05kB  4.49% 82.02%  1536.05kB  4.49%  syscall.ByteSliceFromString
 1024.38kB  2.99% 85.02%  5126.52kB 14.98%  github.com/shirou/gopsutil/internal/common.ReadLinesOffsetN
     515kB  1.51% 86.52%      515kB  1.51%  crypto/x509.(*CertPool).AddCert
(pprof)
我们可以根据如上内存分配情况去review代码,如何减少这些相关的调用,或者优化相关代码逻辑。
当我们不明确这些调用时是被哪些函数引起的时,我们可以输入top -cum来查找,-cum的意思就是,将函数调用关系 中的数据进行累积,比如A函数调用的B函数,则B函数中的内存分配量也会累积到A上面,这样就可以很容易的找出调用链。
(pprof) top20 -cum
Showing nodes accounting for 14393.43kB, 42.07% of 34211.94kB total
Showing top 20 nodes out of 95
      flat  flat%   sum%        cum   cum%
         0     0%     0% 25669.06kB 75.03%  harbor_exporter/collector.(*Exporter).scrape.func1
         0     0%     0% 25669.06kB 75.03%  harbor_exporter/collector.ScrapeSystemSocketInfo.Scrape
         0     0%     0% 14905.07kB 43.57%  github.com/shirou/gopsutil/process.(*Process).OpenFiles (inline)
         0     0%     0% 14905.07kB 43.57%  github.com/shirou/gopsutil/process.(*Process).OpenFilesWithContext
         0     0%     0% 14905.07kB 43.57%  github.com/shirou/gopsutil/process.(*Process).fillFromfdWithContext
         0     0%     0%  9272.51kB 27.10%  github.com/shirou/gopsutil/process.(*Process).fillFromfdListWithContext
         0     0%     0%  9272.51kB 27.10%  os.(*File).Readdirnames (inline)
 9272.51kB 27.10% 27.10%  9272.51kB 27.10%  os.(*File).readdirnames
         0     0% 27.10%  8713.24kB 25.47%  github.com/shirou/gopsutil/process.(*Process).CreateTimeWithContext
         0     0% 27.10%  8713.24kB 25.47%  github.com/shirou/gopsutil/process.(*Process).createTimeWithContext
         0     0% 27.10%  8713.24kB 25.47%  github.com/shirou/gopsutil/process.(*Process).fillFromStatWithContext
  512.05kB  1.50% 28.60%  8713.24kB 25.47%  github.com/shirou/gopsutil/process.(*Process).fillFromTIDStatWithContext
         0     0% 28.60%  8713.24kB 25.47%  github.com/shirou/gopsutil/process.NewProcessWithContext
         0     0% 28.60%  8713.24kB 25.47%  github.com/shirou/gopsutil/process.Processes (inline)
         0     0% 28.60%  8713.24kB 25.47%  github.com/shirou/gopsutil/process.ProcessesWithContext
         0     0% 28.60%  5126.52kB 14.98%  github.com/shirou/gopsutil/internal/common.BootTimeWithContext
         0     0% 28.60%  5126.52kB 14.98%  github.com/shirou/gopsutil/internal/common.ReadLines (inline)
 1024.38kB  2.99% 31.59%  5126.52kB 14.98%  github.com/shirou/gopsutil/internal/common.ReadLinesOffsetN
 3584.50kB 10.48% 42.07%  5120.55kB 14.97%  os.Readlink
         0     0% 42.07%  4685.97kB 13.70%  net/http.(*ServeMux).ServeHTTP
2.4.2.CPU耗时分析
我们可以采用go tool pprof http://127.0.0.1:9090/debug/pprof/profile命令连接到进程中 查看正在使用的一些CPU相关信息。
Type: cpu
Time: Dec 15, 2021 at 2:17pm (CST)
Duration: 30s, Total samples = 10ms (0.033%)
Entering interactive mode (type "help" for commands, "o" for options)
(pprof) top 10
Showing nodes accounting for 10ms, 100% of 10ms total
      flat  flat%   sum%        cum   cum%
      10ms   100%   100%       10ms   100%  runtime.runqgrab
         0     0%   100%       10ms   100%  runtime.findrunnable
         0     0%   100%       10ms   100%  runtime.mcall
         0     0%   100%       10ms   100%  runtime.park_m
         0     0%   100%       10ms   100%  runtime.runqsteal
         0     0%   100%       10ms   100%  runtime.schedule
(pprof)
(pprof) top20 -cum
Showing nodes accounting for 10ms, 100% of 10ms total
      flat  flat%   sum%        cum   cum%
         0     0%     0%       10ms   100%  runtime.findrunnable
         0     0%     0%       10ms   100%  runtime.mcall
         0     0%     0%       10ms   100%  runtime.park_m
      10ms   100%   100%       10ms   100%  runtime.runqgrab
         0     0%   100%       10ms   100%  runtime.runqsteal
         0     0%   100%       10ms   100%  runtime.schedule
2.3.3.获取svg图
在我们执行go tool pprof -inuse_space http://127.0.0.1:9090/debug/pprof/heap命令和go tool pprof http://127.0.0.1:9090/debug/pprof/profile命令都可以在回显中注入svg,这样将会产生一个.svg图片,其会把这些累积关系画成一个拓扑图,提供给 我们。
下面我们取一个图片中的一个片段进行分析:

每一个方块为pprof记录的一个函数调用栈,连线上的标签代表指定的方法调用的采样值(例如时间、内存分配大小等),方框的大小与方法运行的采样值的大小有关。
每个方框由两个标签组成:在 cpu profile 中,一个是方法运行的时间占比,一个是它在采样的堆栈中出现的时间占比(前者是 flat 时间,后者则是 cumulate 时间占比);框越大,代表耗时越多或是内存分配越多。
--inuse/alloc_space --inuse/alloc_objects区别
通常情况下:
1.--inuse_space:用来分析程序常驻内存的占用情况;
2.--alloc_objects:用来分析内存的临时分配情况,可以提高程序的运行速度。
原文:https://www.cnblogs.com/yaohong/