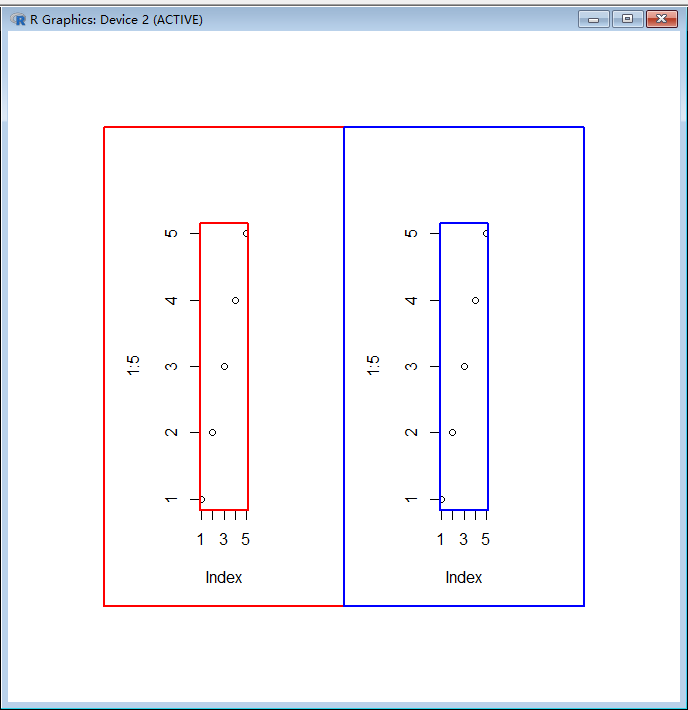
在R语言中,对于图中的点来说,有很多种坐标系来进行定位
举个例子:
par(omi = c(1, 1, 1, 1), mai = c(1, 1, 1, 1), mfrow = c(1, 2))
plot(1:5)
box(which = "plot", col = "red", lwd = 2)
box(which = "figure", col = "red", lwd = 2)
plot(1:5)
box(which = "plot", col = "blue", lwd = 2)
box(which = "figure", col = "blue", lwd = 2)
产生的图片如下:

对于图中的某个具体的点来说,以蓝色子图中的点 (2, 2) 为例,有很多的坐标系统对这个点进行定位:
1) user coordinate system : 最常用的坐标系,就是x轴和y轴构成的坐标系;x轴对应坐标为2, y轴对应坐标为2
2)inches coordinate system : 图像左下角为(0, 0), 距离图像的下边缘和左边缘的实际距离,单位为 inches
代码示例:
> grconvertX(2, from = "user", to = "inches")
[1] 4.634259
> grconvertY(2, from = "user", to = "inches")
[1] 2.802758
通过gronvert 系列 函数可以看到每个点距离图像的下边缘和左边缘的实际距离
3)device coordinate system : 绘图设备系统,单位为
代码示例:
> par(omi = c(1, 1, 1, 1), mai = c(1, 1, 1, 1), yaxs = "i", xaxs = "i")
> plot(1:5)
> grconvertX(1, from = "user", to = "dev")
[1] 192
我们知道点1与绘图设备的水平距离为2 inches , 2 inches = 192 pixes, 所以1 inches = 96 pixes , 相对于incehs coordinate system, 只不过换了一个单位而已
device coordinate system 的衡量单位为像素
4) normalized coordinate system: 以绘图设备的左下角为坐标原点,将长和宽归一化成(0, 1)的区间,整个坐标系统中,绘图设备的左下角为(0,0), 右上角为(1,1)
代码示例:
> grconvertX(2, from = "user", to = "ndc")
[1] 0.662037
> grconvertY(2, from = "user", to = "ndc")
[1] 0.4009908
相当于下面的代码:
> grconvertX(2, from = "user", to = "inches") / par("din")[1]
[1] 0.662037
> grconvertY(2, from = "user", to = "inches") / par("din")[2]
[1] 0.4009908
从上面的代码看出来,normalized coordinate system 系统中点的坐标实际为在绘图设备中的inches / 绘图设备的长或者宽
3) normalized figure system: 和normalize device system 系统类似,只不过是这次相对于figure region 进行了归一化
> grconvertX(2, from = "user", to = "nfc")
[1] 0.4537037
> grconvertY(2, from = "user", to = "nfc")
[1] 0.3613044
相当于下面的代码:
> (grconvertX(2, from = "user", to = "inches") - par("fin")[1] - par("omi")[2])/ par("fin")[1]
[1] 0.4537037
> (grconvertY(2, from = "user", to = "inches") - par("omi")[1])/ par("fin")[2]
[1] 0.3613044
从上面的代码,可以看出相对于figure region进行了归一化
4) normalize plot system : 和normalize device system 系统类似,只不过是这次相对于plot region 进行了归一化
代码示例:
> grconvertX(2, from = "user", to = "npc")
[1] 0.2685185
> grconvertY(2, from = "user", to = "npc")
[1] 0.2685185
相当于下面的代码
> (2 - par("usr")[1]) / (par("usr")[2] - par("usr")[1])
[1] 0.2685185
> (2 - par("usr")[3]) / (par("usr")[4] - par("usr")[3])
[1] 0.2685185
从上面的代码中,就可以看出来归一化的过程