points 用来在一张图表上添加点,指定好对应的x和y坐标,就可以添加不同形状,颜色的点了;
基本用法:
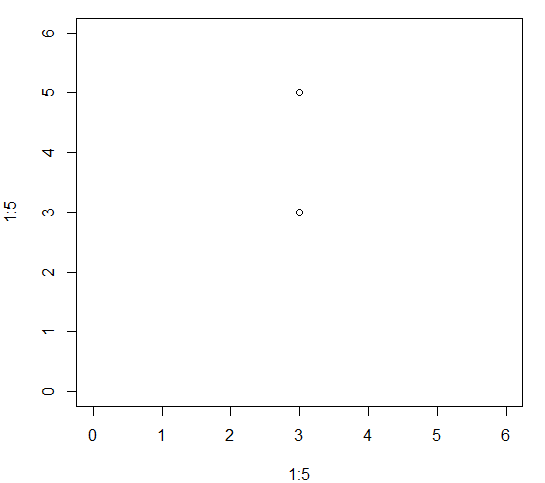
通过x和y设置点的坐标
plot(1:5, 1:5, xlim = c(0,6), ylim = c (0,6), type = "n")
points(x = c(3, 3), y = c(3, 5))
效果图如下:
参数设置:
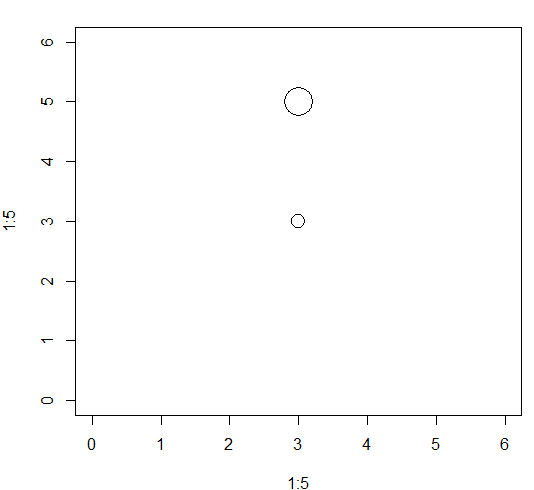
cex : 设置点的大小
代码示例:
plot(1:5, 1:5, xlim = c(0,6), ylim = c (0,6), type = "n")
points(x = c(3, 3), y = c(3, 5), cex = c(2, 4))
效果图如下:
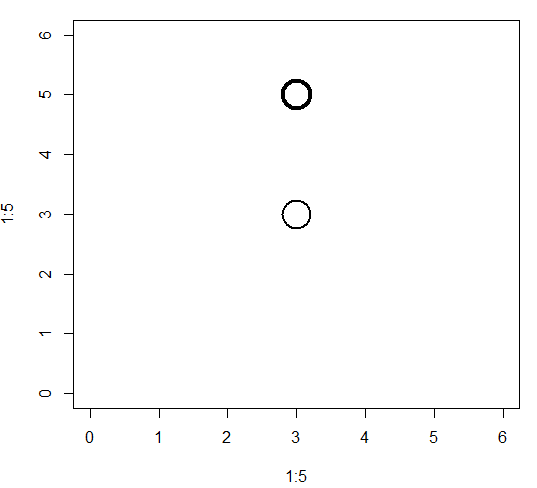
lwd : 设置点的边框的宽度
代码示例:
plot(1:5, 1:5, xlim = c(0,6), ylim = c (0,6), type = "n")
points(x = c(3, 3), y = c(3, 5), cex = 4, lwd = c(2, 4))
效果图如下:
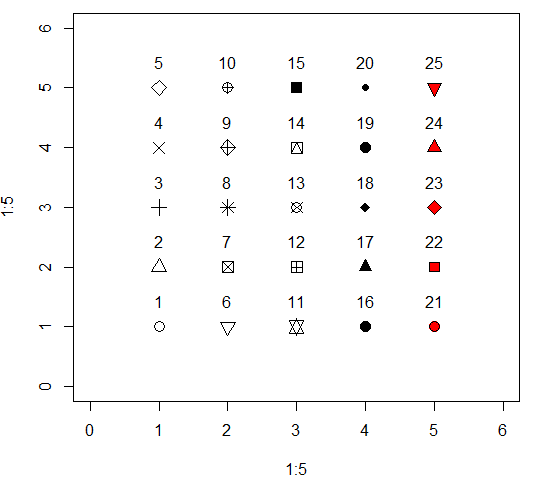
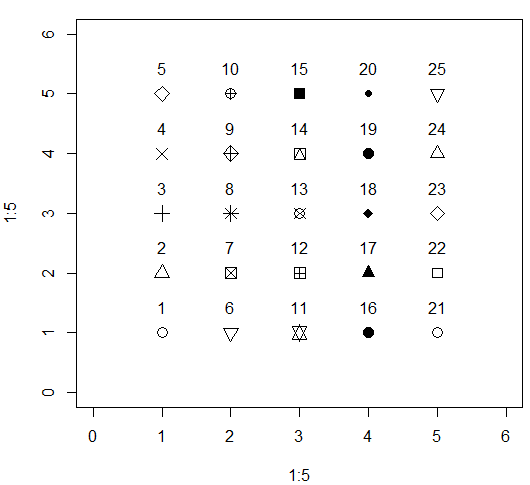
pch : 设置点的形状,取值范围为1到25,
代码示例:
plot(1:5, 1:5, xlim = c(0,6), ylim = c (0,6), type = "n")
index <- 1:25
start <- 0
for (i in 1:5) {
for (j in 1:5) {
start <- start + 1
points(x = i, y = j, pch = index[start], cex = 1.5)
text(x = i, y = j, labels = index[start], pos = 3, offset = 1)
}
}
效果图如下:
col: 设置点的边框的颜色
代码示例:
plot(1:5, 1:5, xlim = c(0,6), ylim = c (0,6), type = "n")
index <- 1:25
start <- 0
for (i in 1:5) {
	for (j in 1:5) {
		start <- start + 1
		points(x = i, y = j, pch  = index[start], cex = 1.5, col = "red")
		text(x = i, y = j, labels = index[start], pos = 3, offset = 1)
	}
}
效果图:

bg : 设置点的背景色,其实就是填充色,需要注意的是,只有形状为21到25的点是有填充色的
代码示例:
plot(1:5, 1:5, xlim = c(0,6), ylim = c (0,6), type = "n")
index <- 1:25
start <- 0
for (i in 1:5) {
	for (j in 1:5) {
		start <- start + 1
		points(x = i, y = j, pch  = index[start], cex = 1.5, bg = "red")
		text(x = i, y = j, labels = index[start], pos = 3, offset = 1)
	}
}
效果图如下: