siege是Linux系统下的一个压力测试的开源工具。
siege安装
sudo apt -get install siege
siege语法格式
siege 【选项】
siege 【选项】URL
siege -g URL
siege选项【Options】
-V, --version VERSION, prints the version number.
-h, --help HELP, prints this section.
-C, --config CONFIGURATION, show the current config.//显示当前的默认装置
-v, --verbose VERBOSE, prints notification to screen.//详细通知打印到屏幕,输出版本信息和siege命令
-q, --quiet QUIET turns verbose off and suppresses output.
-g, --get GET, pull down HTTP headers and display the transaction. Great for application debugging. //get方式
-c, --concurrent=NUM CONCURRENT users, default is 10//并发量,默认是10
-r, --reps=NUM REPS, number of times to run the test.//访问此时,不能与-t同一设置
-t, --time=NUMm TIMED testing where "m" is modifier S, M, or H ex: --time=1H, one hour test.//持续运行siegeNUM秒/分钟/小时
-d, --delay=NUM Time DELAY, random delay before each requst//延迟请求,NUM一般不大于10
-b, --benchmark BENCHMARK: no delays between requests.
-i, --internet INTERNET user simulation, hits URLs randomly.//随机访问url.txt中的url列表项
-f, --file=FILE FILE, select a specific URLS FILE.//选择URL文件
-R, --rc=FILE RC, specify an siegerc file
-l, --log[=FILE] LOG to FILE. If FILE is not specified, the default is used: PREFIX/var/siege.log//指定日志文件
-m, --mark="text" MARK, mark the log file with a string. between .001 and NUM. (NOT COUNTED IN STATS)//标记,用于日志
-H, --header="text" Add a header to request (can be many)//请求头部
-A, --user-agent="text" Sets User-Agent in request//请求代理
-T, --content-type="text" Sets Content-Type in request//请求内容
结果分析:
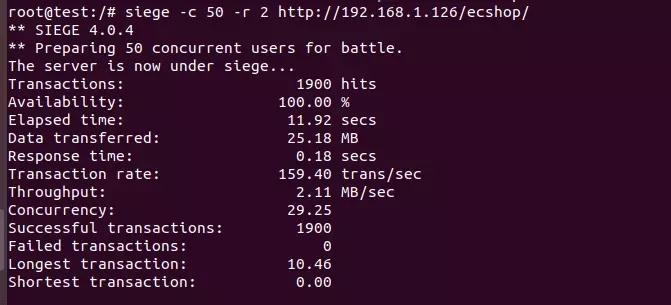
Transactions: 完成了总的点击数
Availability: 事物的成功率
Elapsed time: 测试使用时间
Data transferred: 每个用户的传输数据量
Response time: 平均响应时间
Transaction rate: 服务器每秒处理事务的平均数
Throughput: 吞吐量
Concurrency: 实际最高并发连接数
Successful transactions: 成功事物数
Failed transactions: 失败事物数
Longest transaction: 最长的事务处理时间
Shortest transaction: 最短的事务处理时间
siege -d 10 -i -c 100 -t 10S -f url.txt