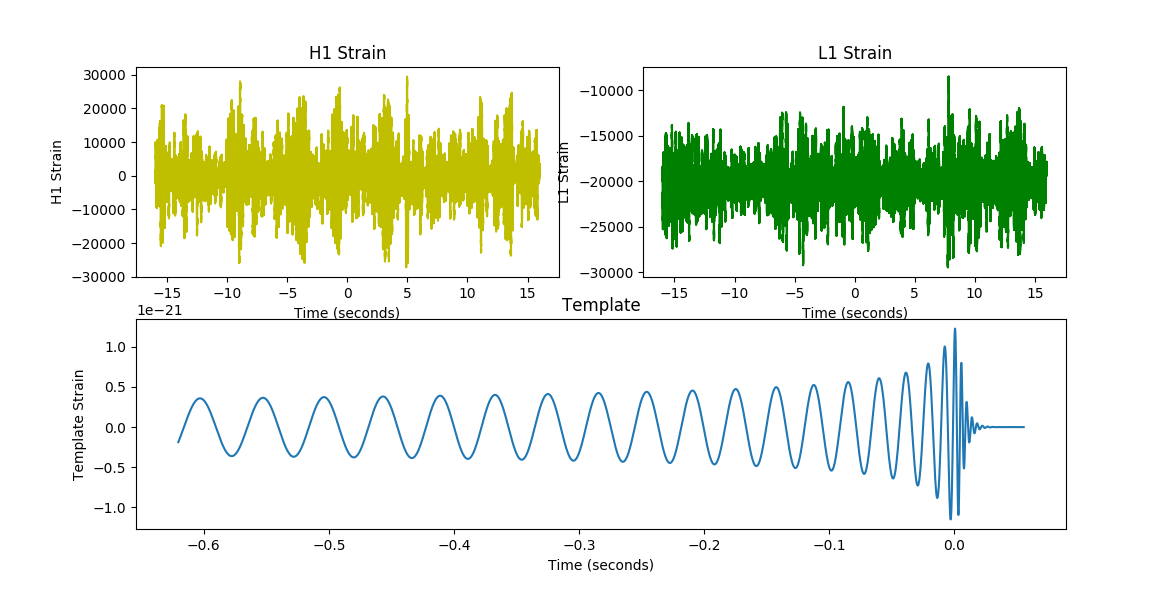
照着老师的代码敲了一遍,但出了一些错误,直接复制也是同样的错误,找了一会儿才知道在第9,10行的1应该改为1.这样算出来的值才是浮点数,而不是0了。
 1 import numpy as np
 2 import matplotlib.pyplot as plt
 3 from scipy.io import wavfile
 4
 5 rate_h, hstrain = wavfile.read(r'H1_Strain.wav','rb')
 6 rate_l, lstrain = wavfile.read(r'L1_Strain.wav','rb')
 7 reftime, ref_H1 = np.genfromtxt("wf_template.txt").transpose()
 8
 9 htime_interval = 1./rate_h
10 ltime_interval = 1./rate_l
11 fig = plt.figure(figsize=(12,6))
12
13 #丢失信号起始点
14 htime_len = hstrain.shape[0]/rate_h
15 htime = np.arange(-htime_len/2, htime_len/2 , htime_interval)
16 plth = fig.add_subplot(221)
17 plth.plot(htime, hstrain, 'y')
18 plth.set_xlabel('Time (seconds)')
19 plth.set_ylabel('H1 Strain')
20 plth.set_title('H1 Strain')
21
22 ltime_len = lstrain.shape[0]/rate_l
23 ltime = np.arange(-ltime_len/2, ltime_len/2, ltime_interval)
24 pltl = fig.add_subplot(222)
25 pltl.plot(ltime, lstrain, 'g')
26 pltl.set_xlabel('Time (seconds)')
27 pltl.set_ylabel('L1 Strain')
28 pltl.set_title('L1 Strain')
29
30 pltref = fig.add_subplot(212)
31 pltref.plot(reftime, ref_H1)
32 pltref.set_xlabel('Time (seconds)')
33 pltref.set_ylabel('Template Strain')
34 pltref.set_title('Template')
35 fig.tight_layout()
36
37 plt.savefig("Gravitational_Waves_Original.png")
38 plt.show()
39 plt.close(fig)