基础
字典
# 字典
me = {'height': 180}
print(me['height'])
me['weight'] = 18
print(me)
读取图片import matplotlib.pyplot as plt
from matplotlib.image import imread
img = imread('lena.jpg')
plt.imshow(img)
plt.show()
类
# 类
class Man:
    def __init__(self, name):
        self.name  = name
        print("Initilized!")
    def hello(self):
        print("Hello " + self.name)
    def goodbye(self):
        print("Good bye "+self.name+" !")
m = Man("David")
m.hello()
m.goodbye()
numpy使用
# numpy使用
import numpy as np

x = np.array([1.0, 2, 3]) # 生成数组
print(x)
print(type(x))

A = np.array([[1, 2], [3, 4]])
print(A)
print(A.shape) # 行、列数量
print(A.dtype)

B = np.array([10, 20])
C = A * B # 广播
print(C)

print(A[0]) # 第0行元素

for row in A:
    print(row)

X = A.flatten() # 将 A 转换为一维数组
print(X)
matplotlib使用
import numpy as np
import matplotlib.pyplot as plt

x = np.arange(0, 6, 0.1) # 以0.1为单位,成0到6的数据
y1 = np.sin(x)
y2 = np.cos(x)

plt.plot(x, y1, label = "sin") # label 为图例
plt.plot(x, y2, linestyle = "--", label = "cos")
plt.xlabel("x")
plt.ylabel("y")
plt.title("sin & cos")
plt.legend() # 图例显示
plt.show()
感知机
与门
# 感知机
def AND(x1, x2):
    # 与门
    w1, w2, theta = 0.5, 0.5, 0.7
    tmp = x1*w1 + x2*w2
    if tmp <= theta:
        return 0
    elif tmp > theta:
        return 1
import numpy as np
x = np.array([0, 1])
w = np.array([0.5, 0.5])
b = -0.7
print(w*x)
print(np.sum(w*x))
print(np.sum(w*x) + b)
def AND1(x1, x2):
    x = np.array([x1, x2])
    w = np.array([0.5, 0.5])
    b = -0.7
    tmp = np.sum(w*x) + b
    if tmp <= 0:
        return 0
    else:
        return 1
a = AND1(0.2, 0)
print(a)
与、非、或、与非、异或
import numpy as np

def AND(x1, x2):
    # 与门
    x = np.array([x1, x2])
    w = np.array([0.5, 0.5])
    b = -0.7
    tmp = np.sum(w*x) + b
    if tmp <= 0:
        return 0
    else:
        return 1
def NAND(x1, x2):
    # 与非门
    x = np.array([x1, x2])
    w = np.array([-0.5, -0.5])
    b = 0.7
    tmp = np.sum(w*x) + b
    if tmp <= 0:
        return 0
    else:
        return 1
def OR(x1, x2):
    # 或门
    x = np.array([x1, x2])
    w = np.array([0.5, 0.5])
    b = -0.2
    tmp = np.sum(w*x) + b
    if tmp <= 0:
        return 0
    else:
        return 1
def XOR(x1, x2):
    # 异或门
    s1 = NAND(x1, x2)
    s2 = OR(x1, x2)
    y = AND(s1, s2)
    return y

if __name__=="__main__":
    for xs in [(0, 0), (1, 0), (0, 1), (1, 1)]:
        y = AND(xs[0], xs[1])
        print(str(xs) + " -> " + str(y))

    for xs in[(0, 0), (1, 0), (0, 1), (1, 1)]:
        y = NAND(xs[0], xs[1])
        print(str(xs) + " -> " + str(y))

    for xs in [(0,0), (1, 0), (0,1 ), (1, 1)]:
        y = OR(xs[0], xs[1])
        print(str(xs) + " -> " + str(y))

    for xs in [(0, 0), (1, 0), (0, 1), (1, 1)]:
        y = XOR(xs[0], xs[1])
        print(str(xs) + " -> " + str(y))
神经网络
激活函数
import numpy as np
import matplotlib.pylab as plt

def sigmoid(x):
    g = 1/(1+np.exp(-x))
    return g

def step_function(x):
    g = np.array(x>0, dtype=np.int)
    return g

x = np.arange(-5.0, 5.0, 0.1)
y1 = sigmoid(x)
y2 = step_function(x)

plt.plot(x, y1, label = 'sigmoid')
plt.plot(x, y2, 'k--', label = 'step_function')
# plt.ylim(-0.1, 1.1) # 指定 y 轴的范围
plt.legend()
plt.show()

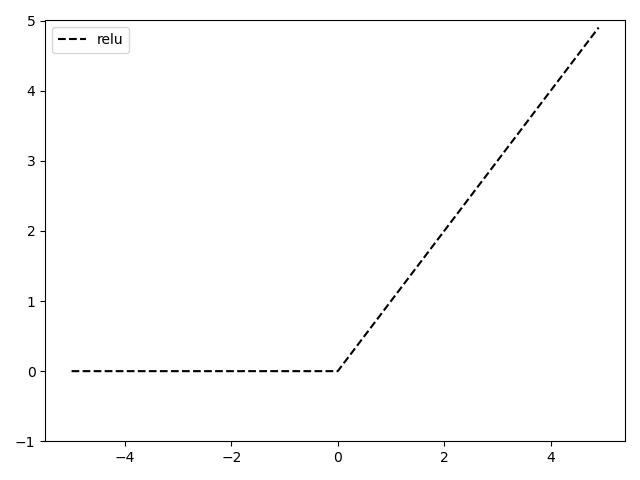
def relu(x):
    # relu函数
    # x < 0 时 输出 0
    # x > 0 时 直接输出 x
    g = np.maximum(0, x)
    return g
x = np.arange(-5.0, 5.0, 0.1)
y = relu(x)
plt.plot(x,y,'k--',label = 'relu')
plt.legend()
plt.ylim(-1.0, 5.0)
plt.show()
import numpy as np

def sigmoid(x):
    # 激活函数
    g = 1 / (1 + np.exp(-x))
    return g

def init_network():
    network = {}
    network['W1']= np.array([[0.1, 0.3, 0.5],
                             [0.2, 0.4, 0.6]])
    network['b1'] = np.array([0.1, 0.2, 0.3])
    network['W2'] = np.array([[0.1, 0.4],
                              [0.2, 0.5],
                              [0.3, 0.6]])
    network['b2'] = np.array([0.1, 0.2])
    network['W3'] = np.array([[0.1, 0.3],
                              [0.2, 0.4]])
    network['b3'] = np.array([0.1, 0.2])

    return network

def identity_function(x):
    # 恒等函数
    return x

def forward(network, x):
    W1, W2, W3 = network['W1'], network['W2'], network['W3']
    b1, b2, b3 = network['b1'], network['b2'], network['b3']

    a1 = np.dot(x, W1) + b1
    z1 = sigmoid(a1)
    a2 = np.dot(a1, W2) + b2
    z2 = sigmoid(a2)
    a3 = np.dot(z2, W3) + b3
    y = identity_function(a3)
    return y

network = init_network()
x = np.array([1.0, 0.5])
y = forward(network, x)
print(y)
对输出函数进行改进
import numpy as np

def sigmoid(x):
    # 激活函数
    g = 1 / (1 + np.exp(-x))
    return g

def init_network():
    network = {}
    network['W1']= np.array([[0.1, 0.3, 0.5],
                             [0.2, 0.4, 0.6]])
    network['b1'] = np.array([0.1, 0.2, 0.3])
    network['W2'] = np.array([[0.1, 0.4],
                              [0.2, 0.5],
                              [0.3, 0.6]])
    network['b2'] = np.array([0.1, 0.2])
    network['W3'] = np.array([[0.1, 0.3],
                              [0.2, 0.4]])
    network['b3'] = np.array([0.1, 0.2])

    return network

def identity_function(x):
    # 输出函数
    # 恒等函数
    return x
def softmax(a):
    # 输出函数
    # 对 溢出问题 进行改进
    c = np.max(a)
    exp_a = np.exp(a -c) # 溢出问题的对策
    sum_exp_a = np.sum(exp_a)
    y = exp_a/sum_exp_a
    return y

def forward(network, x):
    W1, W2, W3 = network['W1'], network['W2'], network['W3']
    b1, b2, b3 = network['b1'], network['b2'], network['b3']

    a1 = np.dot(x, W1) + b1
    z1 = sigmoid(a1)
    a2 = np.dot(a1, W2) + b2
    z2 = sigmoid(a2)
    a3 = np.dot(z2, W3) + b3
    # y = identity_function(a3)
    y = softmax(a3)
    return y

network = init_network()
x = np.array([1.0, 0.5])
y = forward(network, x)
print(y)
单层感知机
import numpy as np
import random
import matplotlib.pyplot as plt

# sign function
def sign(v):
    if v > 0:
        return 1
    else:
        return -1

# train function to get weight and bias
def training():
    train_data1 = [[1, 3, 1], [2, 5, 1], [3, 8, 1], [2, 6, 1]]  # positive sample
    train_data2 = [[3, 1, -1], [4, 1, -1], [6, 2, -1], [7, 3, -1]]  # negative sample
    train_data = train_data1 + train_data2;

    weight = [0, 0]
    bias = 0
    learning_rate = 0.1

    train_num = int(input("train num:"))

    for i in range(train_num):
        train = random.choice(train_data)
        x1, x2, y = train;
        y_predict = sign(weight[0] * x1 + weight[1] * x2 + bias)
        print("train data:x:(%d, %d) y:%d ==>y_predict:%d" % (x1, x2, y, y_predict))
        if y * y_predict <= 0:
            weight[0] = weight[0] + learning_rate * y * x1
            weight[1] = weight[1] + learning_rate * y * x2
            bias = bias + learning_rate * y
            print("update weight and bias:")
            print(weight[0], weight[1], bias)
    print("stop training :")
    print(weight[0], weight[1], bias)

    # plot the train data and the hyper curve
    plt.plot(np.array(train_data1)[:, 0], np.array(train_data1)[:, 1], 'ro')
    plt.plot(np.array(train_data2)[:, 0], np.array(train_data2)[:, 1], 'bo')
    x_1 = []
    x_2 = []
    for i in range(-10, 10):
        x_1.append(i)
        x_2.append((-weight[0] * i - bias) / weight[1])
    plt.plot(x_1, x_2)
    plt.show()

    return weight, bias


# test function to predict
def test():
    weight, bias = training()
    while True:
        test_data = []
        data = input("enter q to quit,enter test data (x1, x2):")
        if data == 'q':
            break
        test_data += [int(n) for n in data.split(',')]
        predict = sign(weight[0] * test_data[0] + weight[1] * test_data[1] + bias)
        print("predict==>%d" % predict)


if __name__ == "__main__":
    test()