一、prometheus下载与安装
1、下载
https://prometheus.io/download/
2、安装
上传prometheus-2.15.2.linux-amd64.tar.gz
tar -xvf prometheus-2.15.2.linux-amd64.tar.gz
mkdir /u01/soft/prometheus/
groupadd prometheus
useradd -g prometheus prometheus -d /u01/soft/prometheus/
mv * /u01/soft/prometheus/
mkdir {data,cfg,logs,bin} -p
mv prometheus promtool bin/
mv prometheus.yml cfg/
3、设置环境变量
vim /etc/profile
PATH= /u01/soft/prometheus/bin:$PATH:$HOME/bin
source /etc/profile
4、创建prometheus.service 的 systemd unit 文件
Description=Prometheus
Documentation=https://prometheus.io/
After=network.target
Type=simple
User=prometheus
ExecStart=/u01/soft/prometheus/bin/prometheus --config.file=/u01/soft/prometheus/cfg/prometheus.yml --storage.tsdb.path=/u01/soft/prometheus/data
Restart=on-failure
WantedBy=multi-user.target
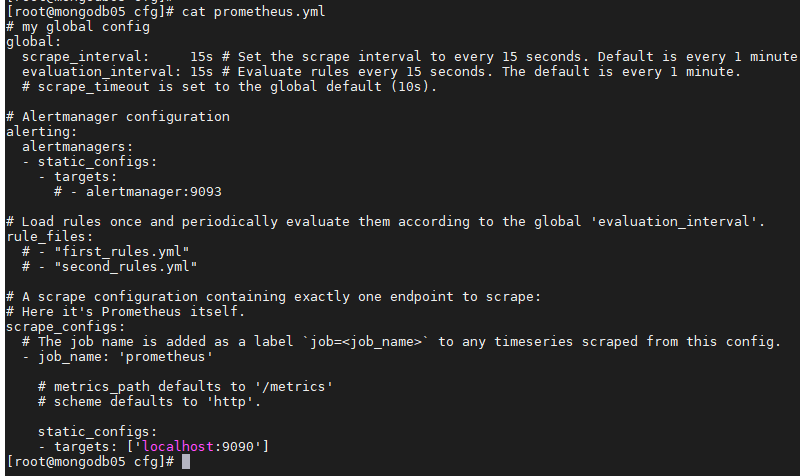
5、prometheus.yml配置文件
6、启动服务
systemctl daemon-reload
systemctl enable prometheus.service
systemctl start prometheus.service
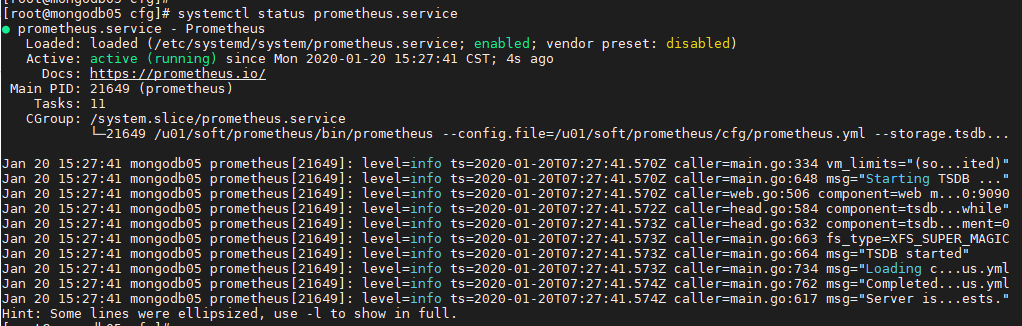
systemctl status prometheus.service
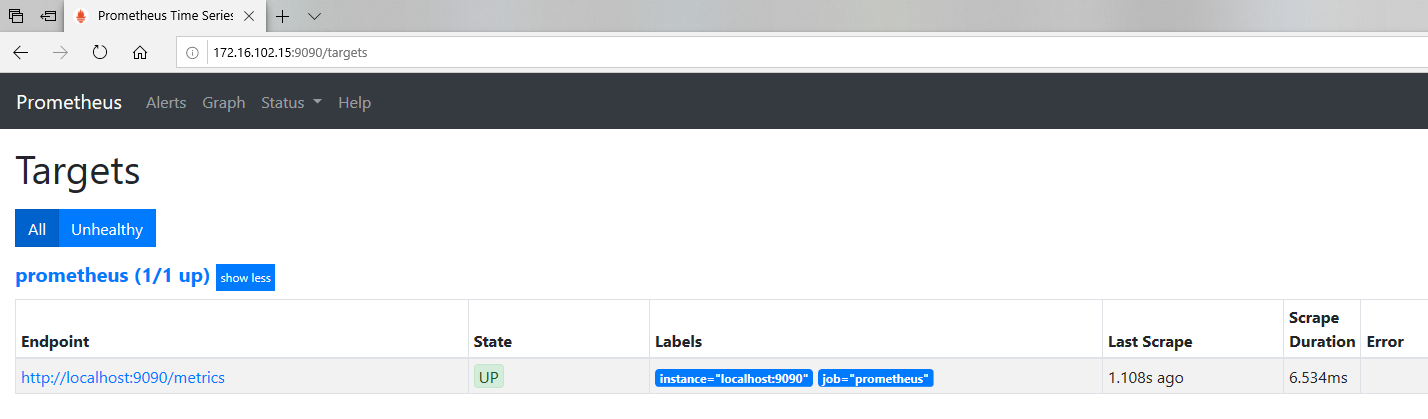
7、登录Prometheus自带有简单的UI
http://172.16.102.15:9090/targets
二、node_exporter下载与安装
1、下载node_exporter
2、安装node_exporter
(如果node_exporter与Prometheus不在同一台机器,请创建Prometheus用户,否则无法启动)
groupadd prometheus
useradd -g prometheus prometheus -d /u01/soft/prometheus/
3、创建node_exporter.service的 systemd unit 文件
[Unit]
Description=node_exporter
Documentation=https://prometheus.io/
After=network.target
Type=simple
User=prometheus
ExecStart=/u01/soft/prometheus/node_exporter/node_exporter
Restart=on-failure
WantedBy=multi-user.target
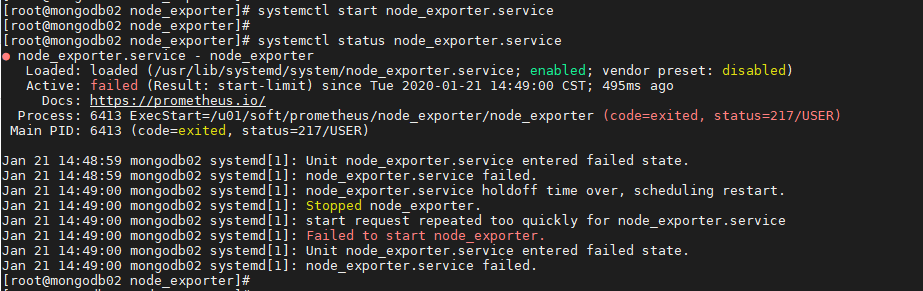
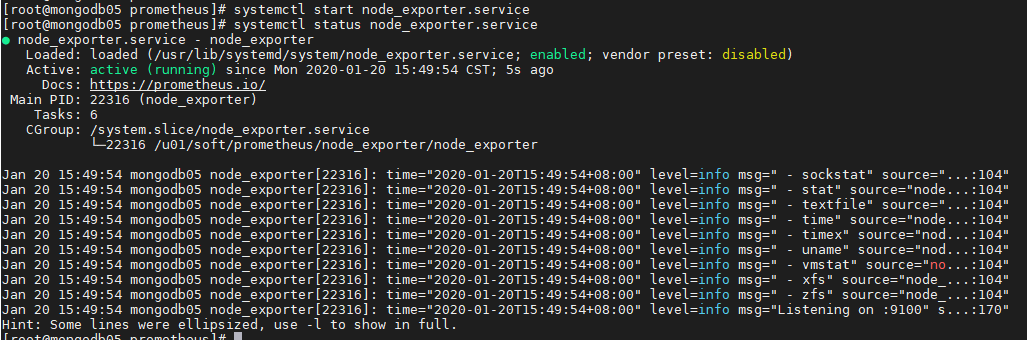
4、启动服务
systemctl daemon-reload
systemctl enable node_exporter.service
systemctl start node_exporter.service
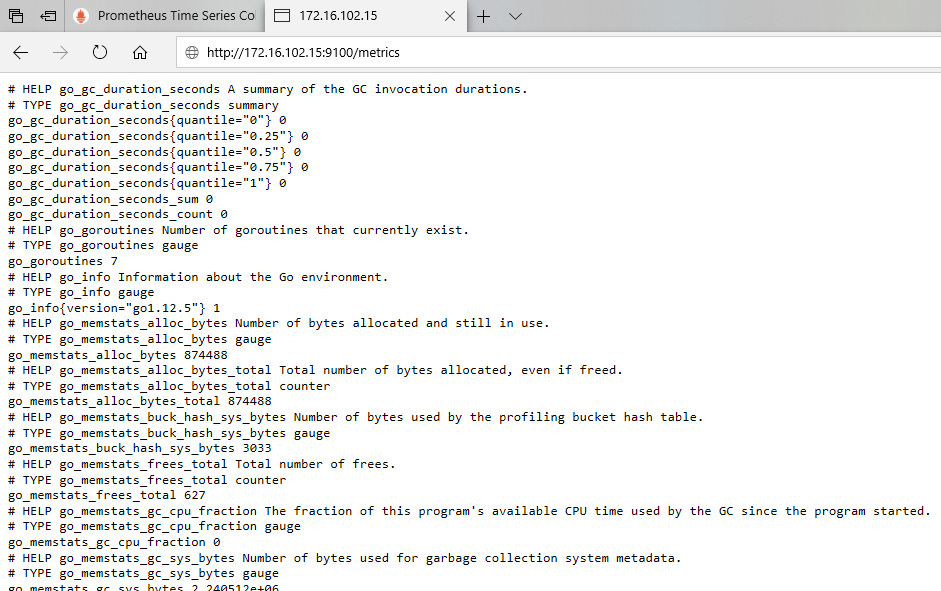
5、客户监控端数据汇报
http://172.16.102.15:9100/metrics
三、grafana下载与安装
1、下载grafana
下载需要登陆
user:xibuhaohao
pass:
https://grafana.com/grafana/download
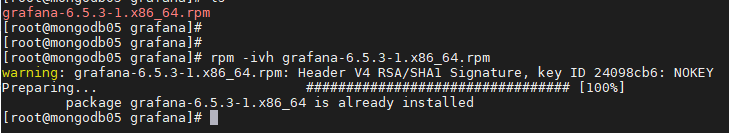
2、安装grafana
mkdir /u01/soft/grafana/
rpm -ivh grafana-6.5.3-1.x86_64.rpm
3、启动服务
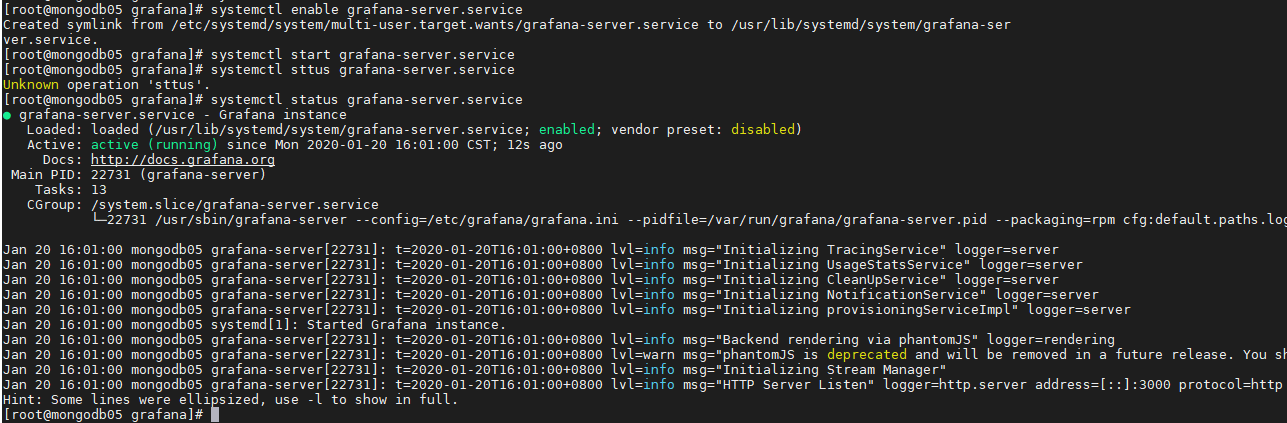
systemctl daemon-reload
systemctl enable grafana-server.service
systemctl start grafana-server.service
systemctl status grafana-server.service
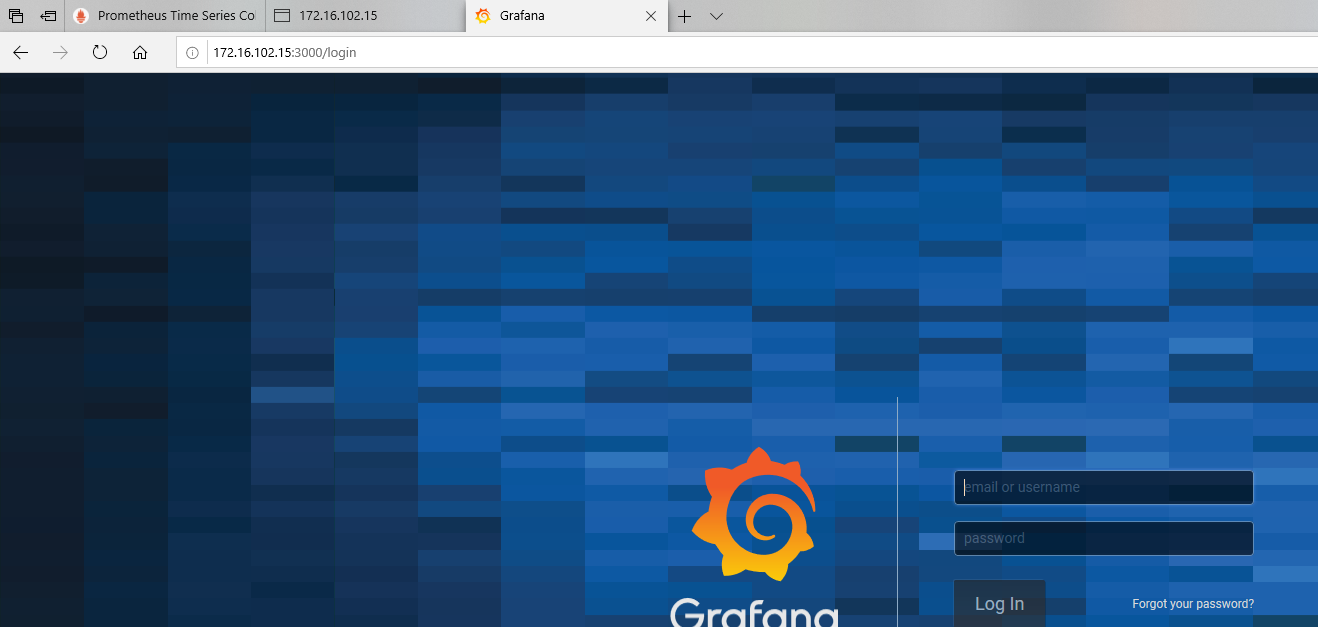
4、访问grafana WEB界面
172.16.102.15:3000/
默认账号/密码:admin/admin