1、InfluxDB安装与使用
Windows安装
wget https://dl.influxdata.com/influxdb/releases/influxdb-1.4.2_windows_amd64.zip
unzip influxdb-1.4.2_windows_amd64.zip
Linux安装
wget https://dl.influxdata.com/influxdb/releases/influxdb-1.6.2.x86_64.rpm
sudo yum localinstall influxdb-1.6.2.x86_64.rpm
InfluxDB配置:influxdb/influxdb.conf
Jmeter使用graphite协议去写入数据到InfluxDB,因此,需要在InfluxDB配置文件启用它,如下图所示:
[[graphite]]
enabled = true
bind-address = ":2003"
database = "jmeter"
retention-policy = ""
protocol = "tcp"
batch-size = 5000
batch-pending = 10
batch-timeout = "1s"
consistency-level = "one"
separator = "."
udp-read-buffer = 0
启动:
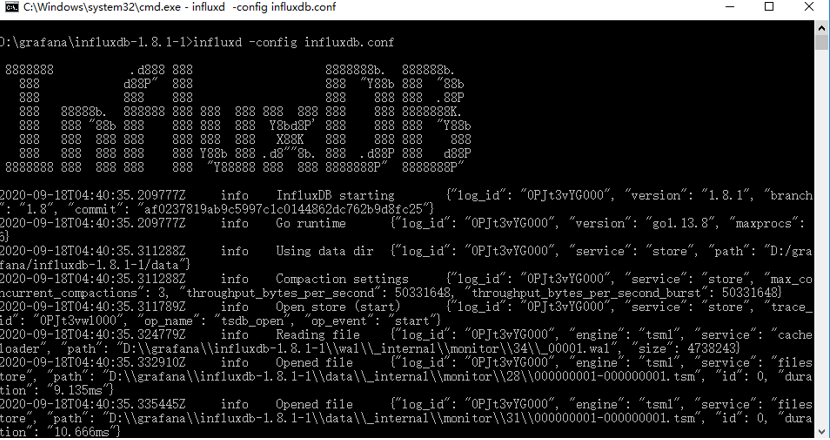
Windows:D:grafanainfluxdb-1.8.1-1>influxd -config influxdb.conf
Linux:influxd -config /etc/influxdb/influxdb.conf
环境变量配置:
Windows-Path:, D:grafanainfluxdb-1.8.1-1influxdb.conf
Linux: $INFLUXDB_CONFIG_PATH = /etc/influxdb/influxdb.conf
InfluxDB操作
D:grafanainfluxdb-1.8.1-1>influx

Connected to http://localhost:8086 version 1.8.1

InfluxDB shell version: 1.8.1

> show databases  #查看所有数据库

name: databases

name

----

_internal

> CREATE DATABASE "jmeter" #创建数据库

> use jmeter               #切换数据库

Using database jmeter

> CREATE USER "admin" WITH PASSWORD 'admin' WITH ALL PRIVILEGES # 创建管理员权限的用户
2、JMeter&InfluxDB集成
Jmeter配置
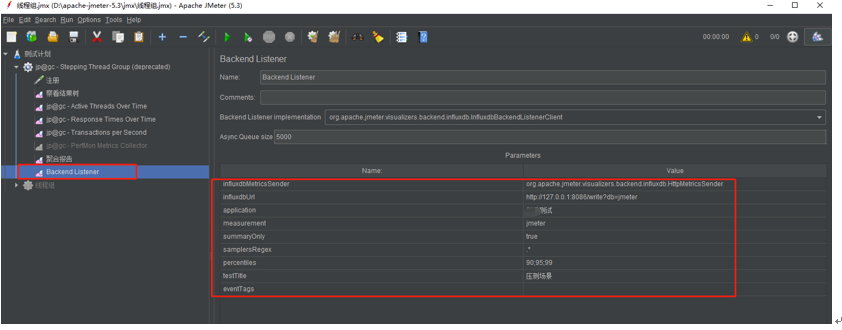
(1)创建一个测试计划,并添加Backend Listener
(2)设置InfluxDB IP及端口设置
(3)运行测试,等待几秒运行测试,等待几秒
(4)查看JMeter是否生成错误日志查看JMeter是否生成错误日志
执行压测后InfluDB查询
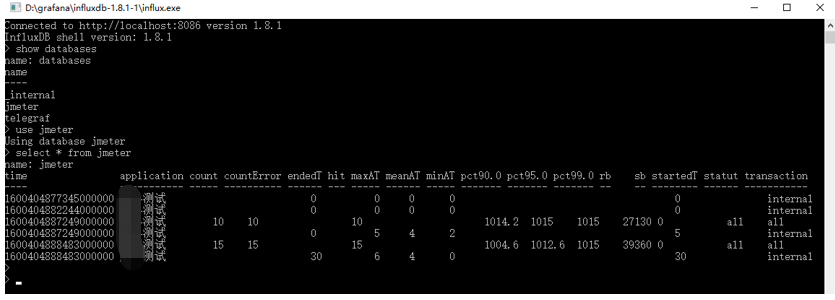
OK,我们已经可以将统计指标数据成功发送到InfluxDB
端口说明:
2003端口,JMeter往数据库发数据的端口
8086端口,Grafana用来从数据库取数据的端口
3、Grafana&InfluxDB集成
(1) 什么是Grafana?
Grafana是一个开源软件,拥有丰富的指标仪表盘和图形编辑器,适用Graphite, Elasticsearch, OpenTSDB, Prometheus,InfluxDB。简单点说就是一套开源WEB可视化平台。
官网地址:https://grafana.com/
(2)Grafana安装与启动
Windows:
Wget
https://s3-us-west-2.amazonaws.com/grafana-releases/release/grafana-4.6.3.windows-x64.zip
unzip grafana-4.6.3.windows-x64.zip
Windows切换到Grafana安装目录中的bin目录下,双击grafana-server.exe启动程序
Linux:
wget https://dl.grafana.com/oss/release/grafana-7.2.1.linux-amd64.tar.gz
tar -zxvf grafana-7.2.1.linux-amd64.tar.gz
Linux启动:
service grafana-server start
Starting grafana-server (via systemctl): [ OK ]
(3) Grafana使用指南
>1. 打开Google Chrome,输入http://localhost:3000 , 使用admin/admin登录本机Grafana,新建influxdb数据源。
第一步:登入Grafana。
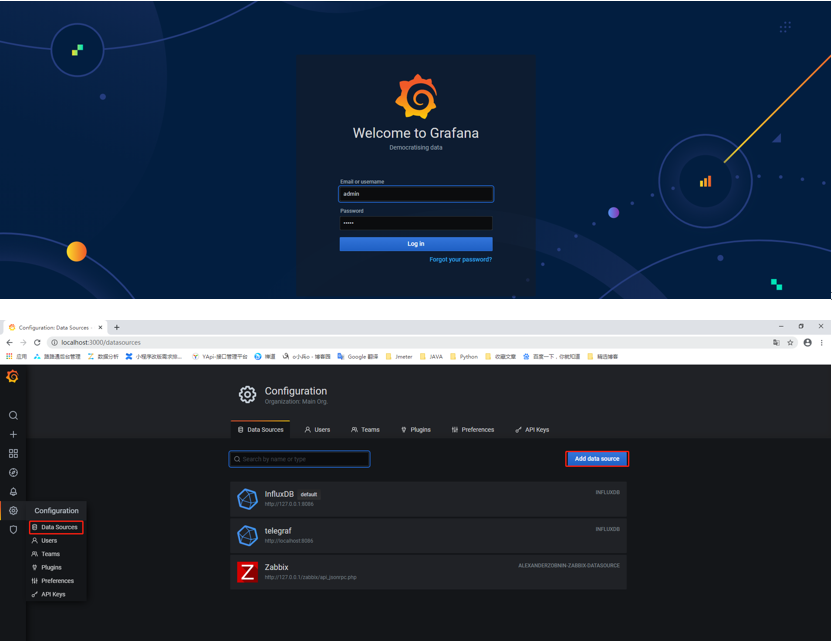
第二步,创建数据源
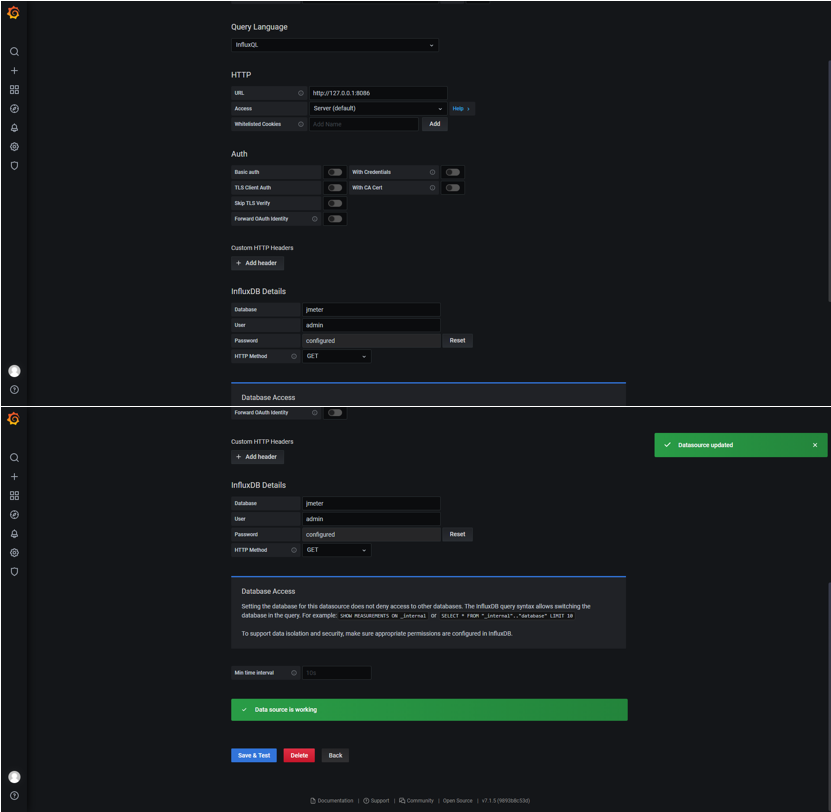
>2. 创建dashboard(新建或者导入)
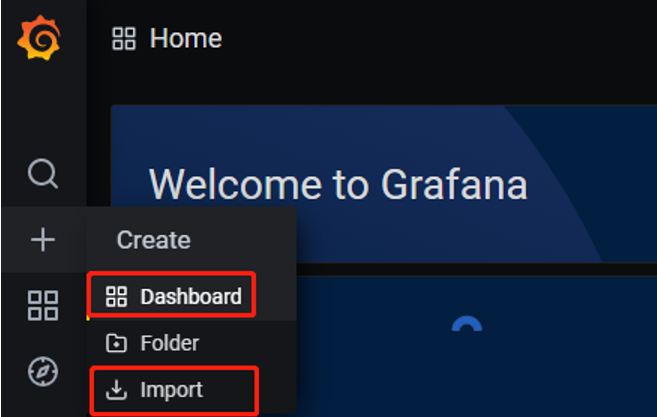
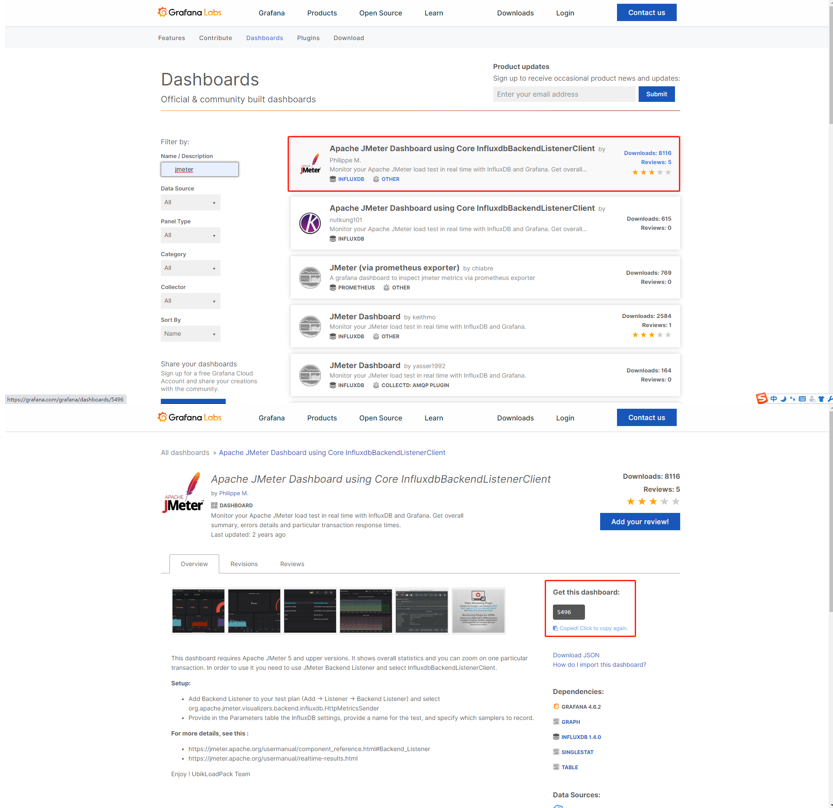
导入模板地址: https://grafana.com/grafana/dashboards挑选下载模板(.json文件)
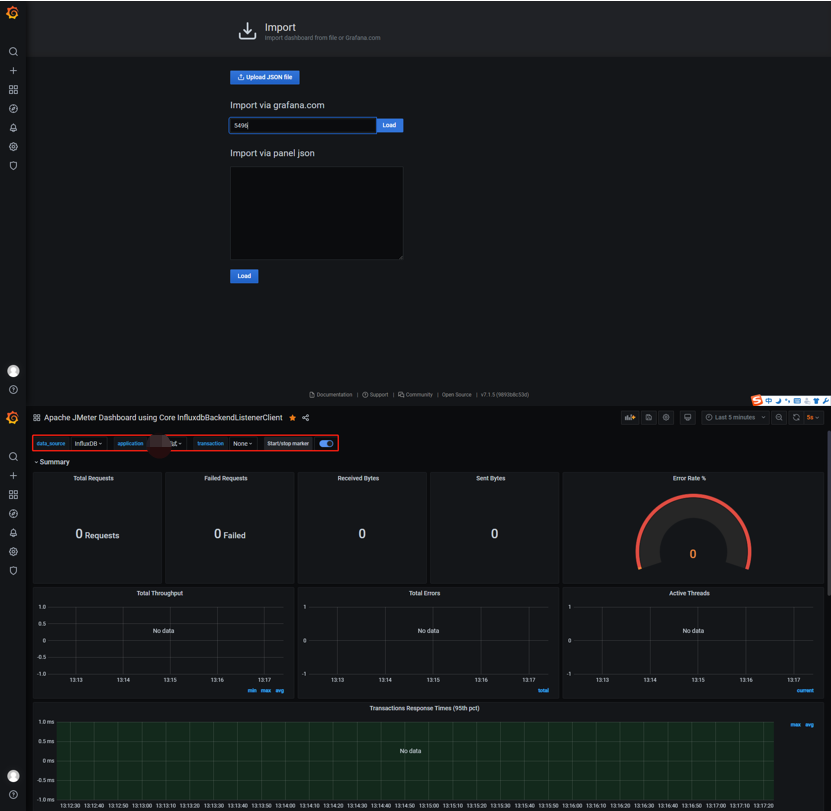
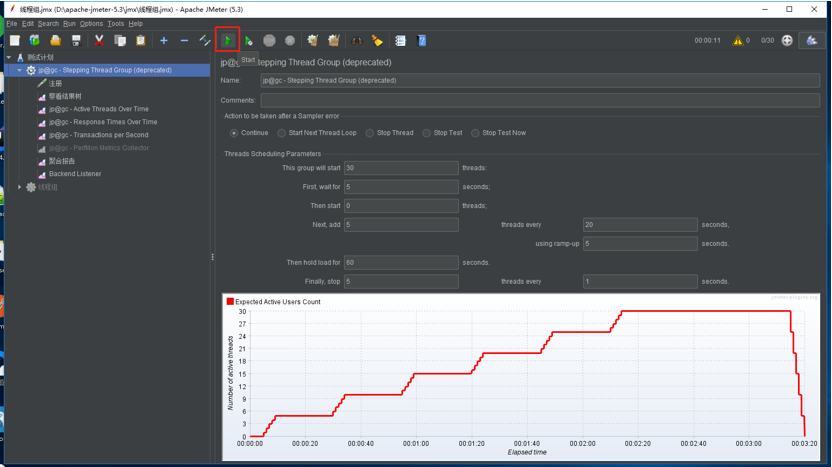
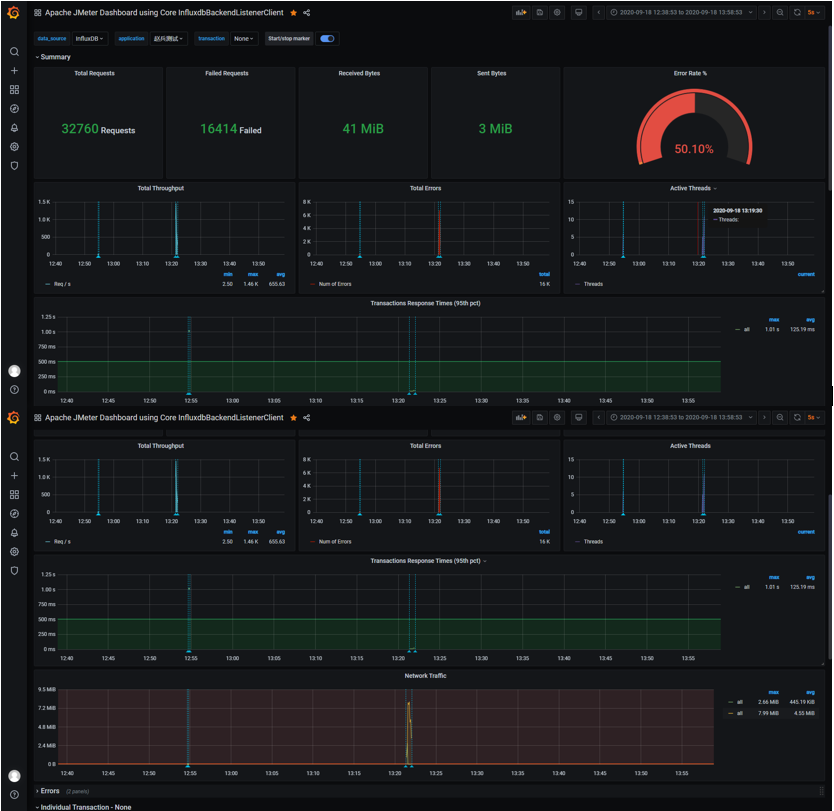
4.执行压力测试实时查看性能监控平台效果图
Jmeter启动压测脚本
平台监控
亲测总结,不足之处后续补充!