1. 绘制简单条形图
# 使用ggplot2和gcookbook
library(ggplot2); library(gcookbook)

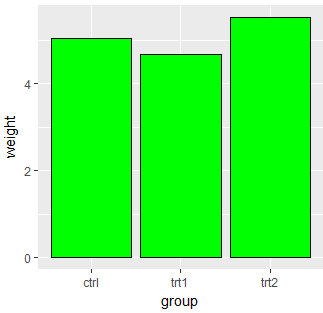
g <- ggplot(data = pg_mean, aes(x = group, y = weight)) +
  geom_bar(stat = "identity", fill = "green", color = "black") # fill表示填充颜色,color表示边线框颜色

g
2. 绘制簇状条形图
# 使用ggplot2和gcookbook的cabbage_exp数据集
library(ggplot2); library(gcookbook)


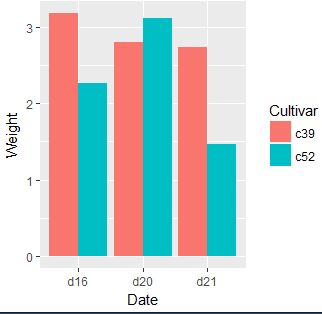
g <- ggplot(data = cabbage_exp, aes(x = Date, y = Weight, fill = Cultivar)) +
  # width表示每个条形的宽度(默认是0.9, 当为0.9时,可以省略width = 0.9), position表示组内条形的间距(position = position_dodge(0.9)可以替换成position = "dodge")
  #geom_bar(stat = "identity",width = 0.9, position = position_dodge(0.9))
  # 上面和下面等价
  geom_bar(stat = "identity", position = "dodge")

g
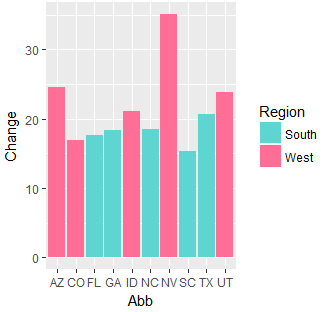
3. 条形图填充颜色
# 使用ggplot2和gcookboo的数据集upc
library(ggplot2); library(gcookbook)

upc <- subset(uspopchange, rank(Change) > 40)

# 使用scale_fill_manual()对颜色进行填充
g <- ggplot(data = upc, aes(x = Abb, y = Change, fill = Region)) +
  geom_bar(stat = "identity") +
  scale_fill_manual(values = c("#5ED5D1", "#FF6E97"))

g
4. 修改坐标名称、标题、添加数据标签
# 使用ggplot2和gcookbook的数据集cabbage
library(ggplot2); library(gcookbook)

# 添加标题、X轴、Y轴

# 方法1(通过ggtitle、xlab、ylab)
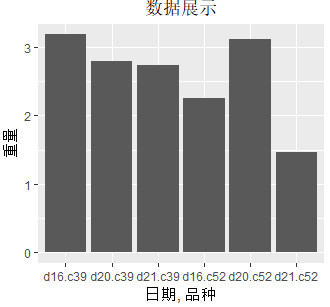
g <- ggplot(data = cabbage_exp, aes(x = interaction(Date, Cultivar), y = Weight)) +
  geom_bar(stat = "identity") +
  ggtitle(label = "数据展示") +
  xlab(label = "日期, 品种") +
  ylab(label = "重量") +
  theme(plot.title = element_text(hjust = 0.5)) # 标题居中

g

# =====================================

# 方法2(通过labs)
g <- ggplot(data = cabbage_exp, aes(x = interaction(Date, Cultivar), y = Weight)) +
  geom_bar(stat = "identity") +
  labs(title = "数据展示", x = "日期, 品种", y = "重量") +
  theme(plot.title = element_text(hjust = 0.5)) # 标题居中

g


# =====================================

# 添加数据标签
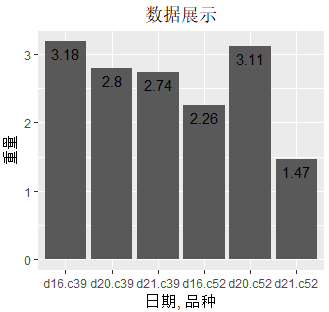
g <- ggplot(data = cabbage_exp, aes(x = interaction(Date, Cultivar), y = Weight)) +
  geom_bar(stat = "identity") +
  labs(title = "数据展示", x = "日期, 品种", y = "重量") +
  theme(plot.title = element_text(hjust = 0.5)) + # 标题居中
  geom_text(aes(label = Weight), vjust = 1.5) # 添加数据标签,并设置位置

g
