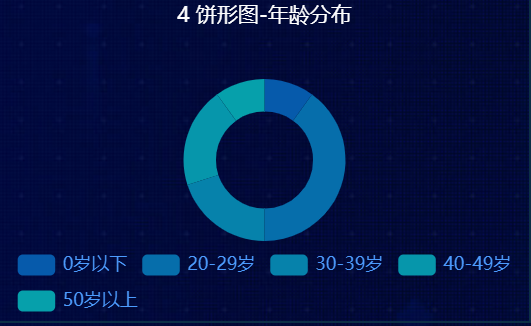
1最简单的饼图

// 定制饼图box4饼形图-年龄分布
(function () {
  const box4 = document.getElementById('box4')
  const mycharts = echarts.init(box4)
  const pieData = [
    { value: 1, name: "0岁以下" },
    { value: 4, name: "20-29岁" },
    { value: 2, name: "30-39岁" },
    { value: 2, name: "40-49岁" },
    { value: 1, name: "50岁以上" }

  ]

  const option = {
    color: [
      "#065aab",
      "#066eab",
      "#0682ab",
      "#0696ab",
      "#06a0ab",
    ],
    title: {
      text: '4 饼形图-年龄分布',
      left: 'center',
      textStyle: {
        color: '#fff',
        fontSize: 14,
        fontWeight: 400
      }
    },
    tooltip: {
      trigger: 'item',
      formatter: '{a} <br/>{b}: {c} ({d}%)',

    },
    legend: {
      orient: 'horizontal',//水平
      left: 'center',
      bottom: 2,
      textStyle: {
        color: '#4c9bfd',
        fontSize: 12,
        fontWeight: 400
      },
      data: ["0岁以下", "20-29岁", "30-39岁", "40-49岁", "50岁以上"],
    },
    series:
    {
      name: '访问来源',
      type: 'pie',
      radius: ['50%', '70%'],
      avoidLabelOverlap: false,
      label: {
        show: false,
        position: 'center'
      },
      emphasis: {
        label: {
          show: false,
          fontSize: '30',
          fontWeight: 'bold'
        }
      },
      //  修改内圆半径和外圆半径为  百分比是相对于容器宽度来说的
      radius: ["30%", "50%"],
      //  控制位置
      center: ["50%", "50%"],
      labelLine: {
        show: false
      },
      data: pieData
    }

  };
  mycharts.setOption(option)

  window.addEventListener("resize", function () {
    myChart.resize();
  });

})();