Theano入门——CIFAR-10和CIFAR-100数据集
1.CIFAR-10数据集介绍
CIFAR-10数据集包含60000个32*32的彩色图像,共有10类。有50000个训练图像和10000个测试图像。
数据集分为5个训练块和1个测试块,每个块有10000个图像。测试块包含从每类随机选择的1000个图像。训练块以随机的顺序包含这些图像,但一些训练块可能比其它类包含更多的图像。训练块每类包含5000个图像。
类间完全互斥。汽车和卡车类没有重叠。“Automobile”只包含sedans,SUVs等等。“Truck”只包含大卡车。两者都不包含皮卡车。
2.CIFAR-10数据集Python版本
存档包含文件data_batch_1,data_batch_2,...,data_batch_5和test_batch。每个文件都是1个Python"pickled"对象。按下面方式加载并返回1个字典:
-
def unpickle(file):
-
import cPickle
-
fo = open(file, 'rb')
-
dict = cPickle.load(fo)
-
fo.close()
-
return dict
每个块文件包含1个带有如下元素的字典:
data——1个10000*3072大小的uint8s数组。数组的每行存储1张32*32的图像。第1个1024包含红色通道值,下1个包含绿色,最后的1024包含蓝色。图像存储以行顺序为主,所以数组的前32列为图像第1行的红色通道值。
labels——1个10000数的范围为0~9的列表。索引i的数值表示数组data中第i个图像的标签。
数据集中包含另外1个叫batches.meta的文件。它也包含1个Python字典对象。有如下列元素:
label_names——1个10元素的列表,给labels中的数值标签以有意义的名称。例如,label_names[0] == "airplane", label_names[1] == "automobile"等。
3.CIFAR-100数据集
数据集包含100小类,每小类包含600个图像,其中有500个训练图像和100个测试图像。100类被分组为20个大类。每个图像带有1个小类的“fine”标签和1个大类“coarse”标签。
4.CIFAR-100数据集Python版本
同CIFAR-10数据集Python版本。
5.CIFAR-10代码实现
(1)CIFAR-10数据集存放在相对文件路径data_dir_cifar10下。
(2)_load_batch_cifar10函数
该函数加载CIFAR-10格式的块文件。根据块文件名filename和相对文件路径data_dir_cifar10拼接得到块文件位置。用numpy中的load函数加载(用cPickle中的load函数也可以加载)返回batch,batch是1个字典,里面包含数据和标签。根据数据的索引'data'得到图像数据,根据标签的索引'labels'得到图像分类的标签,标签转换为one-hot编码形式,见前一篇文章对MNIST数据集的说明。最后把数据和标签中的元素的数据类型统一为dtype类型。
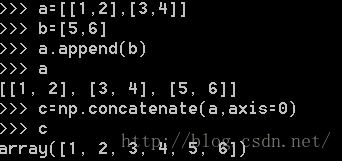
(3)concatenate函数
该函数当axis=0时将矩阵按行顺序从上往下摆放(列长度相等),当axis=1时将矩阵按列顺序从左往右摆放(行长度相等)。
(4)_grayscale函数
该函数首先将a变形为4维张量,维数为(a.shape[0],3,32,32)。之前a为矩阵形式,a的每行代表1个图片样本,a的列为图片中的所有像素按照红,绿,蓝的顺序排序的结果,即依次为图片所有像素红色通道值,图片所有像素绿色通道值,图片所有像素蓝色通道值。3表示颜色通道个数,32表示图片的行数和列数。可以这样理解,reshape函数根据先把二维的矩阵a的所有行排成1行,先把这1行切出a.shape[0]个行b,然后对行b切3份,每份都为行c,对行c切32份,每份为行d,再对行d切32份,每个元素为像素的单通道值。
mean(1)对应的是第2个轴(颜色通道轴),对第2个轴求平均值,即将三通道值求平均,最后第2个轴变为单通道(灰度通道)。最后变形得到2维矩阵(a.shape[0],32*32)。
(5)cifar10函数
cifar函数先调用_load_batch_cifar10函数读取块文件,返回的x和t都是列表形式。所以可以用append连接,连接后每个块文件里面的东西是用中括号括起来的,所以用concatenate函数把外面区分块文件类型的括号去掉。此时得到的x_train的行为图像样本,列为像素的红,绿,蓝通道值;t_train的行为图像标签,列为标签的one-hot编码值。x_test和t_test的结构同理。转换为灰度图像后x_train和x_test为矩阵,行为图像样本,列为像素归一化后的灰度值;t_train和t_test为矩阵,行为图像标签,列为每位one-hot编码值。
-
import numpy as np
-
import os
-
import cPickle as pickle
-
import glob
-
import matplotlib.pyplot as plt
-
-
data_dir = "data"
-
data_dir_cifar10 = os.path.join(data_dir, "cifar-10-batches-py")
-
data_dir_cifar100 = os.path.join(data_dir, "cifar-100-python")
-
-
class_names_cifar10 = np.load(os.path.join(data_dir_cifar10, "batches.meta"))
-
class_names_cifar100 = np.load(os.path.join(data_dir_cifar100, "meta"))
-
-
-
def one_hot(x, n):
-
"""
-
convert index representation to one-hot representation
-
"""
-
x = np.array(x)
-
assert x.ndim == 1
-
return np.eye(n)[x]
-
-
def _load_batch_cifar10(filename, dtype='float64'):
-
"""
-
load a batch in the CIFAR-10 format
-
"""
-
path = os.path.join(data_dir_cifar10, filename)
-
batch = np.load(path)
-
data = batch['data'] / 255.0 # scale between [0, 1]
-
labels = one_hot(batch['labels'], n=10) # convert labels to one-hot representation
-
return data.astype(dtype), labels.astype(dtype)
-
-
-
def _grayscale(a):
-
print a.reshape(a.shape[0], 3, 32, 32).mean(1).reshape(a.shape[0], -1)
-
return a.reshape(a.shape[0], 3, 32, 32).mean(1).reshape(a.shape[0], -1)
-
-
-
def cifar10(dtype='float64', grayscale=True):
-
# train
-
x_train = []
-
t_train = []
-
for k in xrange(5):
-
x, t = _load_batch_cifar10("data_batch_%d" % (k + 1), dtype=dtype)
-
x_train.append(x)
-
t_train.append(t)
-
-
x_train = np.concatenate(x_train, axis=0)
-
t_train = np.concatenate(t_train, axis=0)
-
-
# test
-
x_test, t_test = _load_batch_cifar10("test_batch", dtype=dtype)
-
-
if grayscale:
-
x_train = _grayscale(x_train)
-
x_test = _grayscale(x_test)
-
-
return x_train, t_train, x_test, t_test
-
-
-
def _load_batch_cifar100(filename, dtype='float64'):
-
"""
-
load a batch in the CIFAR-100 format
-
"""
-
path = os.path.join(data_dir_cifar100, filename)
-
batch = np.load(path)
-
data = batch['data'] / 255.0
-
labels = one_hot(batch['fine_labels'], n=100)
-
return data.astype(dtype), labels.astype(dtype)
-
-
-
def cifar100(dtype='float64', grayscale=True):
-
x_train, t_train = _load_batch_cifar100("train", dtype=dtype)
-
x_test, t_test = _load_batch_cifar100("test", dtype=dtype)
-
-
if grayscale:
-
x_train = _grayscale(x_train)
-
x_test = _grayscale(x_test)
-
-
return x_train, t_train, x_test, t_test
-
-
Xtrain, Ytrain, Xtest, Ytest = cifar10()
-
################################################
-
-
# 图像样本显示
-
-
image = Xtrain[0].reshape(32, 32)
-
image1 = Xtrain[255].reshape(32, 32)
-
-
fig = plt.figure()
-
ax = fig.add_subplot(121)
-
plt.axis('off')
-
plt.title(class_names_cifar10['label_names'][list(Ytrain[0]).index(1)])
-
plt.imshow(image, cmap='gray')
-
-
ax = fig.add_subplot(122)
-
plt.title(class_names_cifar10['label_names'][list(Ytrain[255]).index(1)])
-
plt.imshow(image1, cmap='gray')
-
plt.axis('off')
-
plt.show()
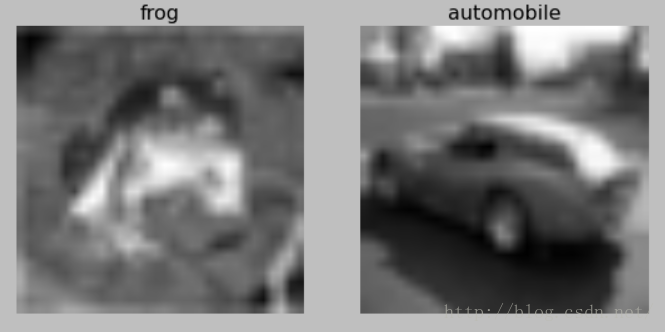
6.实验结果
7.参考链接
(1)CIFAR数据集:http://www.cs.toronto.edu/~kriz/cifar.html
(2)数据集加载:https://github.com/benanne/theano-tutorial/blob/master/load.py