一、确保你的python安装了这些包
# Check the versions of libraries
# Python version
import sys
print('Python: {}'.format(sys.version))
# scipy
import scipy
print('scipy: {}'.format(scipy.__version__))
# numpy
import numpy
print('numpy: {}'.format(numpy.__version__))
# matplotlib
import matplotlib
print('matplotlib: {}'.format(matplotlib.__version__))
# pandas
import pandas
print('pandas: {}'.format(pandas.__version__))
# scikit-learn
import sklearn
print('sklearn: {}'.format(sklearn.__version__))
如果电脑都安装了,会有如下输出:
Python: 3.7.1 (default, Dec 10 2018, 22:54:23) [MSC v.1915 64 bit (AMD64)]
scipy: 1.1.0
numpy: 1.15.4
matplotlib: 3.0.2
pandas: 0.23.4
sklearn: 0.20.1
Scipy是一个用于数学、科学、工程领域的常用软件包,可以处理插值、积分、优化、图像处理、常微分方程数值解的求解、信号处理等问题。它用于有效计算Numpy矩阵,使Numpy和Scipy协同工作,高效解决问题。
NumPy(Numerical Python) 是 Python 语言的一个扩展程序库,支持大量的维度数组与矩阵运算,此外也针对数组运算提供大量的数学函数库。
Matplotlib 是 Python 编程语言及其数值数学扩展包 NumPy 的可视化操作界面。它为利用通用的图形用户界面工具包。
pandas提供了大量能使我们快速便捷地处理数据的函数和方法。
sklearn是机器学习中常用的第三方模块,对常用的机器学习方法进行了封装,包括回归(Regression)、降维(Dimensionality Reduction)、分类(Classfication)、聚类(Clustering)等方法。
二、下面是鸢尾花的模型分析:
import pandas as pd
from pandas.plotting import scatter_matrix
import matplotlib.pyplot as plt
from sklearn import model_selection
from sklearn.metrics import classification_report
from sklearn.metrics import confusion_matrix
from sklearn.metrics import accuracy_score
from sklearn.linear_model import LogisticRegression
from sklearn.tree import DecisionTreeClassifier
from sklearn.neighbors import KNeighborsClassifier
from sklearn.discriminant_analysis import LinearDiscriminantAnalysis
from sklearn.naive_bayes import GaussianNB
from sklearn.svm import SVC
import warnings
#将鸢尾花数据集导入
input_file = "F://python入门//文件//Iris数据集//iris.csv"
f = open(input_file)
names = ['Sepal_Length','Sepal_Width','Petal_Length','Petal_Width','Species']
dataset = pd.read_csv(f, names=names)
#查看数据的形状属性,多少行,多少列
print('查看数据的形状属性:')
print(dataset.shape)
#查看数据的前十行
print('查看数据的前十行:')
print(dataset.head(10))
#查看数据的统计性描述
print('查看数据的统计性描述:')
print(dataset.describe())
#输出箱线图
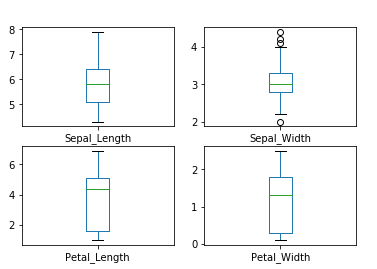
print('查看每个输入变量的箱线图:')
dataset.plot(kind='box', subplots=True, layout=(2,2), sharex=False, sharey=False)
plt.show()
#输出一个直方图
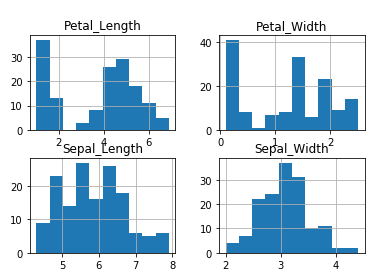
print('查看每个输入变量的直方图:')
dataset.hist()
plt.show()
#散点图
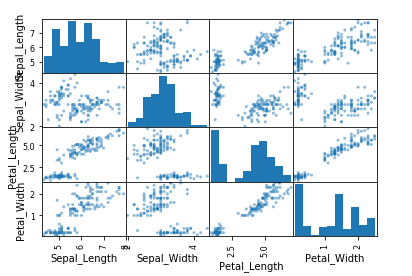
print('全部属性对的散点图:')
scatter_matrix(dataset)
plt.show()
#将导入的数据集拆分为两部分,80% 用于训练模型,20% 用于验证模型。
array = dataset.values
X = array[:,0:4]
Y = array[:,4]
validation_size = 0.20
seed = 7
#训练集和验证集
X_train, X_validation, Y_train, Y_validation =
model_selection.train_test_split(X, Y,test_size=validation_size, random_state=seed)
#每次运行算法前都要重新设置随机数量的种子,以确保是在用相同的数据拆分来评估每个算法
#现在我们用“准确率”这个维度去评估模型,也就是能正确预测出鸢尾花类别的比例
seed = 7
#用准确率这个维度评估模型
scoring = 'accuracy'
#逻辑回归(LR)
#线性判别分析(LDA)
#K最近邻算法(KNN)
#分类和回归树(CART)
#高斯朴素贝叶斯(NB)
#支持向量机(SVM)
models = []
models.append(('LR', LogisticRegression(solver='liblinear')))
models.append(('LDA', LinearDiscriminantAnalysis()))
models.append(('KNN', KNeighborsClassifier()))
models.append(('CART', DecisionTreeClassifier()))
models.append(('NB', GaussianNB()))
models.append(('SVM', SVC()))
# evaluate each model in turn
results = []
names = []
#遍历每个方法
print('输出每个方法的均值和标准差:')
for name, model in models:
    kfold = model_selection.KFold(n_splits=10, random_state=seed)
    cv_results = model_selection.cross_val_score(model, X_train, Y_train, cv=kfold, scoring=scoring)
    results.append(cv_results)
    names.append(name)
    msg = "%s: %f (%f)" % (name, cv_results.mean(), cv_results.std())
    print(msg)
#消除警告
warnings.filterwarnings("ignore")
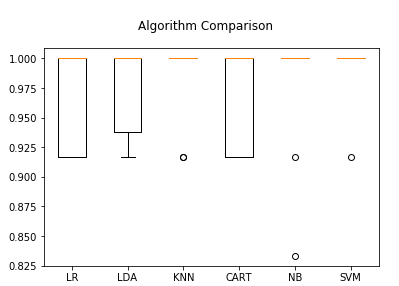
#用箱线图将模型评估结果表示出来
fig = plt.figure()
fig.suptitle('Algorithm Comparison')
ax = fig.add_subplot(111)
plt.boxplot(results)
ax.set_xticklabels(names)
print('利用箱线图衡量各模型方法的准确率:')
plt.show()
#经过验证,KNN 算法的准确率最高。现在我们看看该模型在验证集上的准确度。
knn = KNeighborsClassifier()
knn.fit(X_train, Y_train)
predictions = knn.predict(X_validation)
#模型的准确率
print('模型的准确率:')
print(accuracy_score(Y_validation, predictions))
#混淆矩阵
print('混淆矩阵:')
print(confusion_matrix(Y_validation, predictions))
#分类报告显示了每个类别的精确率、召回率、F1 值
print('分类报告:')
print(classification_report(Y_validation, predictions))
输出结果:
查看数据的形状属性:
(150, 5)
查看数据的前十行:
   Sepal_Length  Sepal_Width  Petal_Length  Petal_Width Species
0           5.1          3.5           1.4          0.2  setosa
1           4.9          3.0           1.4          0.2  setosa
2           4.7          3.2           1.3          0.2  setosa
3           4.6          3.1           1.5          0.2  setosa
4           5.0          3.6           1.4          0.2  setosa
5           5.4          3.9           1.7          0.4  setosa
6           4.6          3.4           1.4          0.3  setosa
7           5.0          3.4           1.5          0.2  setosa
8           4.4          2.9           1.4          0.2  setosa
9           4.9          3.1           1.5          0.1  setosa
查看数据的统计性描述:
       Sepal_Length  Sepal_Width  Petal_Length  Petal_Width
count    150.000000   150.000000    150.000000   150.000000
mean       5.843333     3.057333      3.758000     1.199333
std        0.828066     0.435866      1.765298     0.762238
min        4.300000     2.000000      1.000000     0.100000
25%        5.100000     2.800000      1.600000     0.300000
50%        5.800000     3.000000      4.350000     1.300000
75%        6.400000     3.300000      5.100000     1.800000
max        7.900000     4.400000      6.900000     2.500000
查看每个输入变量的箱线图:

查看每个输入变量的直方图:

全部属性对的散点图:

输出每个方法的均值和标准差:
LR: 0.966667 (0.040825)
LDA: 0.975000 (0.038188)
KNN: 0.983333 (0.033333)
CART: 0.966667 (0.040825)
NB: 0.975000 (0.053359)
SVM: 0.991667 (0.025000)
利用箱线图衡量各模型方法的准确率:

模型的准确率:
0.9
混淆矩阵:
[[ 7  0  0]
 [ 0 11  1]
 [ 0  2  9]]
分类报告:
              precision    recall  f1-score   support

      setosa       1.00      1.00      1.00         7
  versicolor       0.85      0.92      0.88        12
   virginica       0.90      0.82      0.86        11

   micro avg       0.90      0.90      0.90        30
   macro avg       0.92      0.91      0.91        30
weighted avg       0.90      0.90      0.90        30