转载自博客:https://blog.csdn.net/qiu931110/article/details/68130199
matplotlib.pyplot.scatter
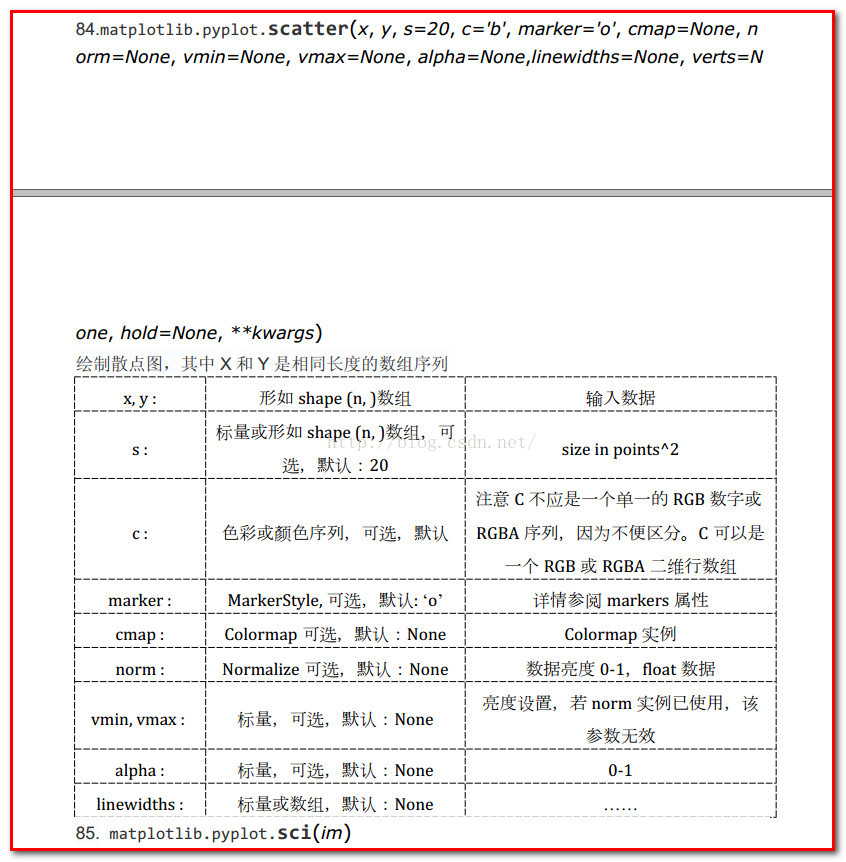
1、scatter函数原型
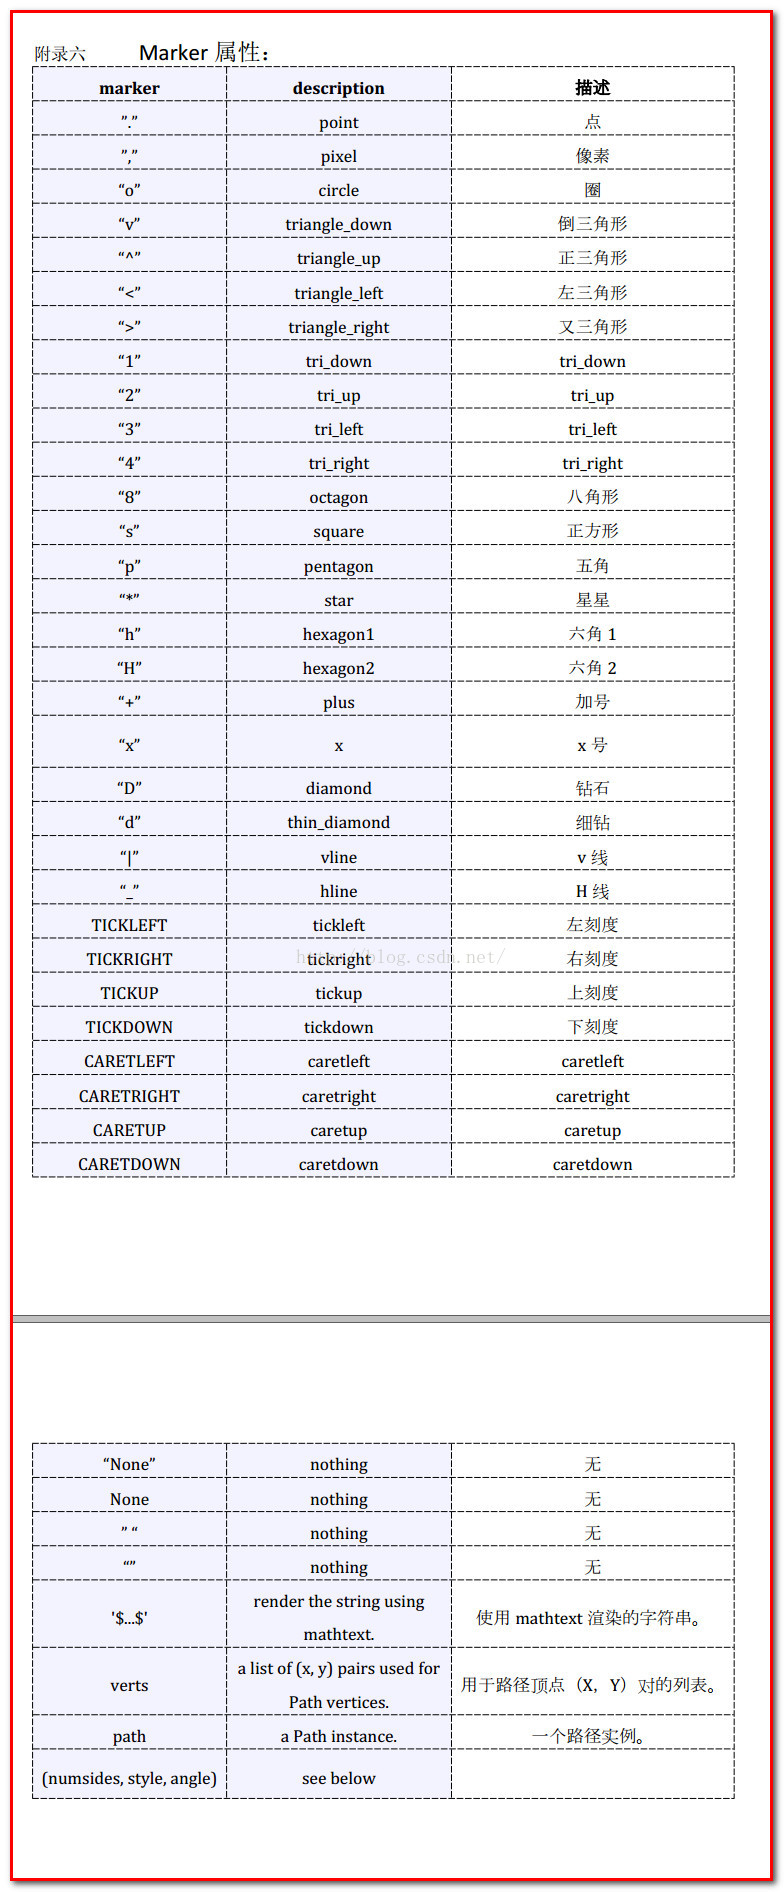
2、其中散点的形状参数marker如下:
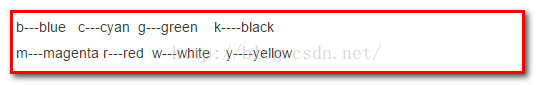
3、其中颜色参数c如下:
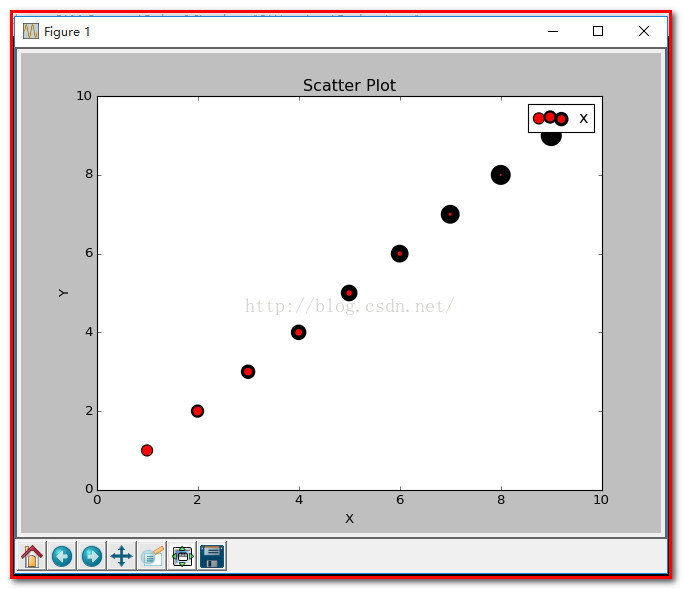
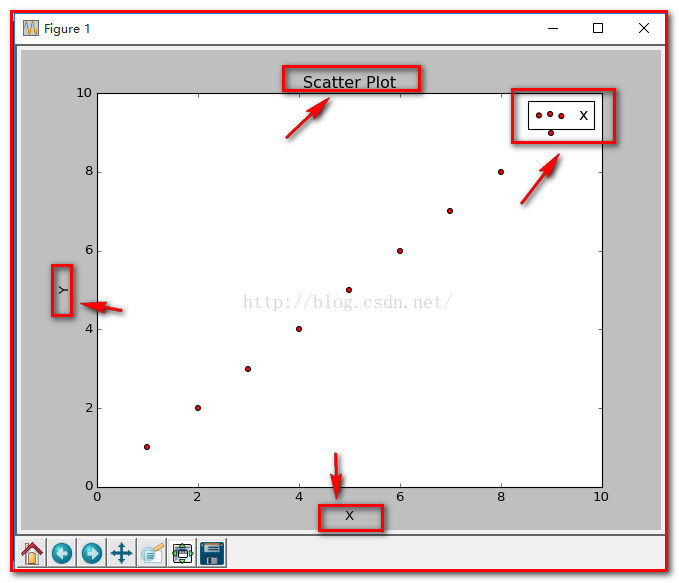
4、基本的使用方法如下:
#导入必要的模块
import numpy as np
import matplotlib.pyplot as plt
#产生测试数据
x = np.arange(1,10)
y = x
fig = plt.figure()
ax1 = fig.add_subplot(111)
#设置标题
ax1.set_title('Scatter Plot')
#设置X轴标签
plt.xlabel('X')
#设置Y轴标签
plt.ylabel('Y')
#画散点图
ax1.scatter(x,y,c = 'r',marker = 'o')
#设置图标
plt.legend('x1')
#显示所画的图
plt.show()
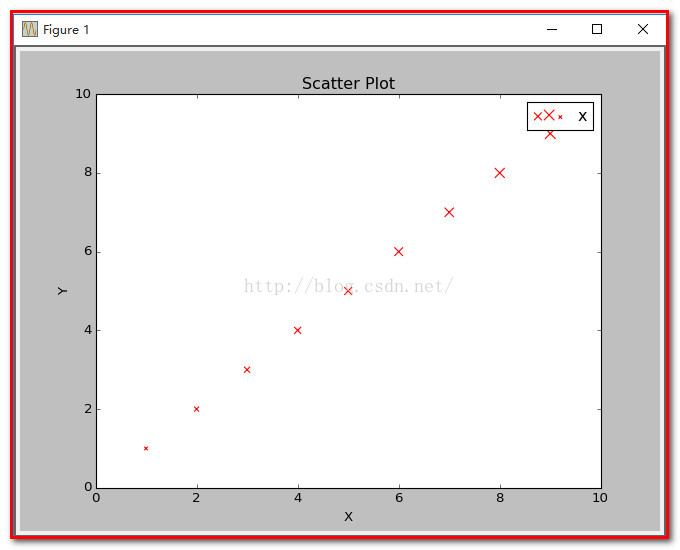
5、当scatter后面参数中数组的使用方法,如s,当s是同x大小的数组,表示x中的每个点对应s中一个大小,其他如c,等用法一样,如下:
(1)、不同大小
#导入必要的模块
import numpy as np
import matplotlib.pyplot as plt
#产生测试数据
x = np.arange(1,10)
y = x
fig = plt.figure()
ax1 = fig.add_subplot(111)
#设置标题
ax1.set_title('Scatter Plot')
#设置X轴标签
plt.xlabel('X')
#设置Y轴标签
plt.ylabel('Y')
#画散点图
sValue = x*10
ax1.scatter(x,y,s=sValue,c='r',marker='x')
#设置图标
plt.legend('x1')
#显示所画的图
plt.show()
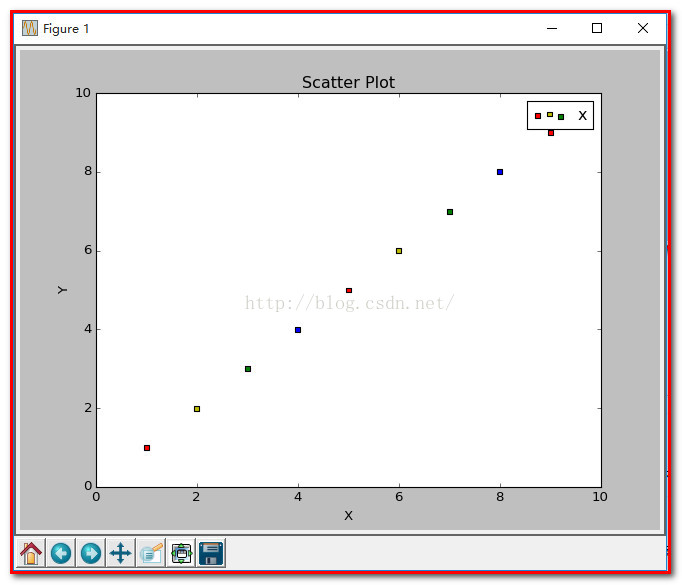
(2)、不同颜色
#导入必要的模块
import numpy as np
import matplotlib.pyplot as plt
#产生测试数据
x = np.arange(1,10)
y = x
fig = plt.figure()
ax1 = fig.add_subplot(111)
#设置标题
ax1.set_title('Scatter Plot')
#设置X轴标签
plt.xlabel('X')
#设置Y轴标签
plt.ylabel('Y')
#画散点图
cValue = ['r','y','g','b','r','y','g','b','r']
ax1.scatter(x,y,c=cValue,marker='s')
#设置图标
plt.legend('x1')
#显示所画的图
plt.show()
(3)、线宽linewidths
#导入必要的模块
import numpy as np
import matplotlib.pyplot as plt
#产生测试数据
x = np.arange(1,10)
y = x
fig = plt.figure()
ax1 = fig.add_subplot(111)
#设置标题
ax1.set_title('Scatter Plot')
#设置X轴标签
plt.xlabel('X')
#设置Y轴标签
plt.ylabel('Y')
#画散点图
lValue = x
ax1.scatter(x,y,c='r',s= 100,linewidths=lValue,marker='o')
#设置图标
plt.legend('x1')
#显示所画的图
plt.show()