本节概要
pandas简介
安装
pip install pandas
pandas的2个主要数据结构:DataFrame 和 Series
Series
series是一种类似于一维数组的对象,它由一组数据以及一组与之相关的数据标签(索引)组成。仅由一组数组即可产生最简单的Series:
obj = Series([4, 7, 9, -1])
print(obj)

0    4
1    7
2    9
3   -1
dtype: int64
Series的字符串表现形式为索引在左边,值在右边。没有设定索引,会自动穿件一个0~N-1的整数型索引。
obj = Series([4, 7, 9, -1])
print(obj.values)
print(obj.index)

[ 4  7  9 -1]
RangeIndex(start=0, stop=4, step=1)
创建一个含有自定义索引的series
obj = Series([4, 7, 9, -1], index=['a', 'b', 'c', 'd'])
print(obj)
print(obj.index)

a    4
b    7
c    9
d   -1
dtype: int64
Index(['a', 'b', 'c', 'd'], dtype='object')
索引取值
obj['a']    ==> 4
obj['c']    ==> 9
obj['a', 'd']    ==> 4, -1
NumPy数组运算都会保留索引跟值之间的链接:
obj[obj>2]

a    4
b    7
c    9
dtype: int64

obj*2

a     8
b    14
c    18
d    -2
dtype: int64
series可以看成是一个有序字典,因为存在index到value的一个映射关系。可以应用在许多原本需要字典参数的函数中:
'b' i obj ==> True
如果数据存放在Python字典中,也可以直接用字典穿件series:
dict_obj = {"a":100,"b":20,"c":50,"d":69}
obj = Series(dict_obj)
dict_obj

a    100
b     20
c     50
d     69
dtype: int64
如果传入一个字典,还有index列表:
dict_obj = {"a":100,"b":20,"c":50,"d":69}
states = ['LA','b','a','NY']
obj = Series(dict_obj, index=states)

LA      NaN
b      20.0
a     100.0
NY      NaN
dtype: float64
我们发现匹配项会被找出来放在相应的位置,而没有匹配的则用NAN(not a number)表示缺失。pandas的isnull 和notnull函数可以用于检测数据缺失:
pd.isnull(obj)

LA     True
b     False
a     False
NY     True
dtype: bool
Series也有类似的用法:
obj.isnull()

LA     True
b     False
a     False
NY     True
dtype: bool
Series 最重要的一个功能是:它在算术运算中会自动对齐不同索引的数据
dict_obj = {"a":100,"b":20,"c":50,"d":69}
dict_obj1 = {"e":100,"b":20,"c":50,"f":69}

obj = Series(dict_obj)
obj1 = Series(dict_obj1)

obj+obj1

a      NaN
b     40.0
c    100.0
d      NaN
e      NaN
f      NaN
dtype: float64
Series对象的name属性
obj.name='qty'
obj.index.name = 'types'


types
a    100
b     20
c     50
d     69
Name: qty, dtype: int64
Series索引可以通过赋值的方式就地修改:
obj.index = ['dandy','renee','Jeff','Steve']
obj

dandy    100
renee     20
Jeff      50
Steve     69
Name: qty, dtype: int64
DataFrame
dataframe是一个表格型的数据结构,它含有一组有序列,每列可以是不通的值的类型。DataFrame既有行索引,又有列索引,它可以看成是series组成的字典(共用同一个索引)。
构建DataFrame
data = {'states':['NY', 'LA', 'CA', 'BS', 'CA'],
        'year':[2000, 2001, 2002, 2001, 2000],
        'pop':[1.5, 1.7, 3.6, 2.4, 2.9]}
frame = DataFrame(data)
frame


   pop states  year
0  1.5     NY  2000
1  1.7     LA  2001
2  3.6     CA  2002
3  2.4     BS  2001
4  2.9     CA  2000
指定列序列
frame2 = DataFrame(data, columns=['year', 'pop', 'states', 'test'])
frame2.columns

   year  pop states test
0  2000  1.5     NY  NaN
1  2001  1.7     LA  NaN
2  2002  3.6     CA  NaN
3  2001  2.4     BS  NaN
4  2000  2.9     CA  NaN

Index(['year', 'pop', 'states', 'test'], dtype='object')
# 不存在的列就会产生NaN值
取值:
# 取一列数据的2种方式
frame2['states']
frame2.year


0    NY
1    LA
2    CA
3    BS
4    CA
Name: states, dtype: object

0    2000
1    2001
2    2002
3    2001
4    2000
Name: year, dtype: int64
# 返回一个series

# 修改行索引
DataFrame(data, columns=['year', 'pop', 'states', 'test'], index=['one', 'two', 'three', 'four', 'five'])

       year  pop states test
one    2000  1.5     NY  NaN
two    2001  1.7     LA  NaN
three  2002  3.6     CA  NaN
four   2001  2.4     BS  NaN
five   2000  2.9     CA  NaN

获取列
frame2.ix['three']

year      2002
pop        3.6
states      CA
test       NaN
Name: three, dtype: object

列可以通过赋值的方式修改
frame2.test = '11'

       year  pop states test
one    2000  1.5     NY   11
two    2001  1.7     LA   11
three  2002  3.6     CA   11
four   2001  2.4     BS   11
five   2000  2.9     CA   11
列操作:
将列表或数组赋值给某个列时,其长度必须跟DataFrame的长度相匹配。如果是Series则会精确匹配DataFrame索引,所有空位被填上缺失值
val = Series([-1, -2, 3], index=['two', 'one', 'three'])
frame2['test'] = val

frame2

       year  pop states  test
one    2000  1.5     NY  -2.0
two    2001  1.7     LA  -1.0
three  2002  3.6     CA   3.0
four   2001  2.4     BS   NaN
five   2000  2.9     CA   NaN
为不存在的列赋值,会创建出一列新列。del用于删除,跟python字典用法很像
frame2['test1'] = frame2.test.notnull()
frame2

       year  pop states  test  test1
one    2000  1.5     NY  -2.0   True
two    2001  1.7     LA  -1.0   True
three  2002  3.6     CA   3.0   True
four   2001  2.4     BS   NaN  False
five   2000  2.9     CA   NaN  False
del frame2['test1']
frame2

       year  pop states  test
one    2000  1.5     NY  -2.0
two    2001  1.7     LA  -1.0
three  2002  3.6     CA   3.0
four   2001  2.4     BS   NaN
five   2000  2.9     CA   NaN
嵌套字典创建dataframe
pop = {
    "dandy":{"age":18, "gender":"male"},
    "elina": {"age": 16, "gender": "female"},
    "renee": {"age": 16, "gender": "female"},
    "taylor": {"age": 18, "gender": "female"},
}
frame3 = DataFrame(pop)

frame3

       dandy   elina   renee  taylor
age       18      16      16      18
gender  male  female  female  female

frame3.T  # 转置

       age  gender
dandy   18    male
elina   16  female
renee   16  female
taylor  18  female
series组成的字典创建:
pdata = {'dandy': frame3['dandy'][:-1],
         'elina': frame3['elina']}
frame4 = DataFrame(pdata)
frame4

       dandy   elina
age       18      16
gender   NaN  female
设置属性名
frame3.index.name = 'detail'
frame3.columns.name = 'name'

frame3

name   dandy   elina   renee  taylor
detail
age       18      16      16      18
gender  male  female  female  female
values属性
frame3.values  # 以二维ndarray的形式返回dataframe中的数据

[[18 16 16 18]
 ['male' 'female' 'female' 'female']]
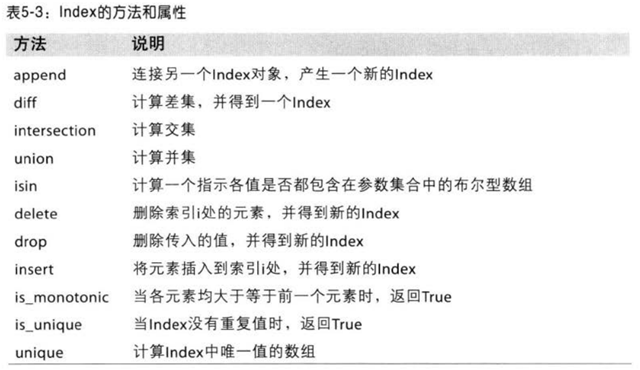
索引对象
pandas的索引对象负责管理轴标签和其他元素(轴名称等)。构建series或者dataframe时,所用到的任何数组和其他序列的标签都会被转成一个Index。Index对象是不可修改的(immutable)。
obj = Series(range(3), index=['a', 'b', 'c'])
Index = obj.index
Index[0]

a
如果输入Index[0] = 'x':
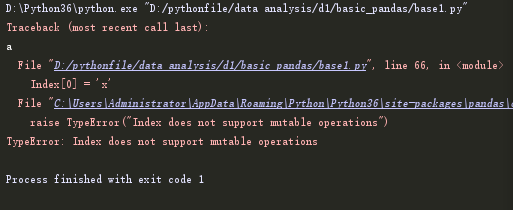
正是因为index的不可修改性,才能使Index对象在多个数据结构之间安全共享:
Index = pd.Index(np.arange(3))
obj2 = Series([1.5, -2, 0], index=Index)

obj2.index is Index

True
除了长得像数组,Index的功能也类似一个固定大小的集合:
pop = {
    "dandy":{"age":18, "gender":"male"},
    "elina": {"age": 16, "gender": "female"},
    "renee": {"age": 16, "gender": "female"},
    "taylor": {"age": 18, "gender": "female"},
}
frame3 = DataFrame(pop)
'dandy' in frame3.columns

True
基本功能
obj = Series([4, 6, 9.9, 7], index=['a', 'v', 'b', 'd'])
obj

a    4.0
v    6.0
b    9.9
d    7.0
dtype: float64
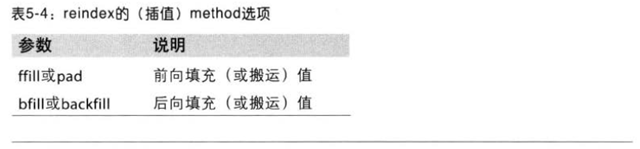
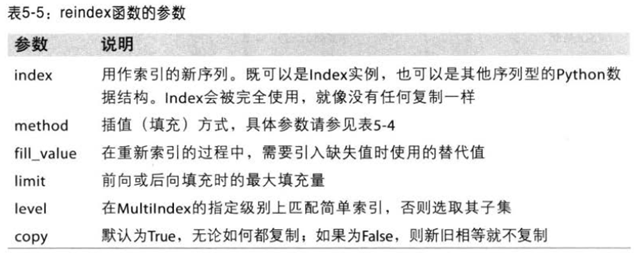
reindex
obj2 = obj.reindex(['a', 'b', 'c', 'd', 'v'])  # 不存在的NaN

obj2

a    4.0
b    9.9
c    NaN
d    7.0
v    6.0
dtype: float64


# 引入fill_value=0
obj2 = obj.reindex(['a', 'b', 'c', 'd', 'v'], fill_value=0)
obj2

a    4.0
b    9.9
c    0.0
d    7.0
v    6.0
dtype: float64

#method
obj = Series(['aa', 'bb', 'cc', 'dd'], index=[0,2,4,6])
obj2 = obj.reindex(range(7), method='ffill')

0    aa
1    aa
2    bb
3    bb
4    cc
5    cc
6    dd
dtype: object
frame = DataFrame(np.arange(9).reshape((3,3)), index=['a', 'b', 'c'], columns=['Ohio', 'Texas', 'California'])
frame2 =frame.reindex(['a', 'b', 'c', 'd'])
frame

   Ohio  Texas  California
a     0      1           2
b     3      4           5
c     6      7           8

frame2

   Ohio  Texas  California
a   0.0    1.0         2.0
b   3.0    4.0         5.0
c   6.0    7.0         8.0
d   NaN    NaN         NaN

text = ['Texas', 'LA', 'California']
frame3 = frame.reindex(columns=text)
frame3

   Texas  LA  California
a      1 NaN           2
b      4 NaN           5
c      7 NaN           8
同时对行列重新索引,插值只能按行应用(轴0)
text = ['Texas', 'LA', 'California']
frame.reindex(index=['a','b','c','d','e','f'], method='ffill').reindex(columns=text)


   Texas  LA  California
a      1 NaN           2
b      1 NaN           2
c      4 NaN           5
d      4 NaN           5
e      7 NaN           8
f      7 NaN           8
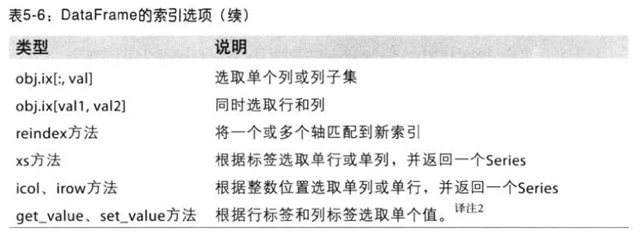
利用ix的标签索引功能,重新索引会更简洁,ix(索引,列)
frame.ix[['a','b','c','d'],text]

   Texas  LA  California
a    1.0 NaN         2.0
b    NaN NaN         NaN
c    4.0 NaN         5.0
d    NaN NaN         NaN
丢弃指定轴上的项
drop方法,返回的是一个在指定轴上删除了指定值的新对象:
obj = Series(np.arange(5), index=['a','b','c','d','e'])
new_obj = obj.drop('c')
new_obj

a    0
b    1
d    3
e    4
dtype: int32
对于DataFrame,可以删除任意轴上的索引值:
data = DataFrame(np.arange(16).reshape(4,4),
                 index=['LA','UH','NY','BS'],
                 columns=['one','two','three','four'])
data.drop(['LA','BS'])

    one  two  three  four
UH    4    5      6     7
NY    8    9     10    11

#对于列,axis=1
data.drop(['one','three'], axis=1)

    two  four
LA    1     3
UH    5     7
NY    9    11
BS   13    15
索引、选取和过滤
Series索引的工作方式类似于NumPy数组的索引,只不过Series的索引值不只是整数。
obj = Series(np.arange(4), index=['a','b','c','d'])
obj

a    0
b    1
c    2
d    3
dtype: int32

obj['b']  # 或者obj[1]
1


obj[2:4]  # 或者obj[['c','d']]
c    2
d    3
dtype: int32

obj[[1,3]]
b    1
d    3
dtype: int32


obj[obj>2]
d    3
dtype: int32
标签切片跟普通的python切片运算不同,其末端是包含的:
obj['b':'c']
b    1
c    2
dtype: int32

obj['b':'c'] = 5
obj
a    0
b    5
c    5
d    3
dtype: int32
对DataFrame进行索引,现在看来就是获取一个或多个列:
data = DataFrame(np.arange(16).reshape((4,4)),
                 index=['aa','bb','cc','dd'],
                 columns=['one','two','three','four'])
data['two']
aa     1
bb     5
cc     9
dd    13
Name: two, dtype: int32

data[['three','two']]
    three  two
aa      2    1
bb      6    5
cc     10    9
dd     14   13

data[:2]
    one  two  three  four
aa    0    1      2     3
bb    4    5      6     7

data[data['three']>5]
    one  two  three  four
bb    4    5      6     7
cc    8    9     10    11
dd   12   13     14    15
这里可能大家都会对于最后的布尔感到惊讶:
data>5
      one    two  three   four
aa  False  False  False  False
bb  False  False   True   True
cc   True   True   True   True
dd   True   True   True   True


data[data<5]=0
data
    one  two  three  four
aa    0    0      0     0
bb    0    5      6     7
cc    8    9     10    11
dd   12   13     14    15
这段代码使DataFrame在语法上更像ndarray。
至于行标签索引,用ix索引字段。它使你可以通过NumPy式的标记法以及轴标签从DataFrame中选取行和列的子集。ix(索引,列)
data.ix[['cc','bb'],[3,0,1]]
    four  one  two
cc    11    8    9
bb     7    0    5

data.ix['dd',['three','two']]
three    14
two      13
Name: dd, dtype: int32

data.ix[2]
one       8
two       9
three    10
four     11
Name: cc, dtype: int32

data.ix[:'cc','two']
aa    0
bb    5
cc    9
Name: two, dtype: int32

data.ix[data.three>5,:3]
    one  two  three
bb    0    5      6
cc    8    9     10
dd   12   13     14

数据运算和数据对齐
算术运算:
s1 = Series([7.3, -2.5, 3.4, 1.5], index=['a','b','c','e'])
s2 = Series([2.3, -2.4, 6.9, 8.1], index=['a','c','d','f'])

s1
a    7.3
b   -2.5
c    3.4
e    1.5
dtype: float64

s2
a    2.3
c   -2.4
d    6.9
f    8.1
dtype: float64

s3
a    9.6
b    NaN
c    1.0
d    NaN
e    NaN
f    NaN
dtype: float64
可以发现自动的数据对齐操作,在不重叠的索引出直接引入了NaN值。缺失值会在datafram运算过程中传播,对齐操作同时作用在行和列上。
df1 = DataFrame(np.arange(9).reshape((3,3)),columns=list('bcd'),
                index=['aa','bb','cc'])
df2 = DataFrame(np.arange(12).reshape((4,3)),columns=list('abc'),
                index=['aa','cc','dd','ee'])

df1
    b  c  d
aa  0  1  2
bb  3  4  5
cc  6  7  8

df2
    a   b   c
aa  0   1   2
cc  3   4   5
dd  6   7   8
ee  9  10  11

df1 + df2
     a     b     c   d
aa NaN   1.0   3.0 NaN
bb NaN   NaN   NaN NaN
cc NaN  10.0  12.0 NaN
dd NaN   NaN   NaN NaN
ee NaN   NaN   NaN NaN
在算术方法中填充值
df1 = DataFrame(np.arange(9).reshape((3,3)),columns=list('bcd'))
df2 = DataFrame(np.arange(20).reshape((4,5)),columns=list('abcde'))

df1.add(df2, fill_value=0)
      a     b     c     d     e
0   0.0   1.0   3.0   5.0   4.0
1   5.0   9.0  11.0  13.0   9.0
2  10.0  17.0  19.0  21.0  14.0
3  15.0  16.0  17.0  18.0  19.0
类似的,在对Series和DataFrame重新索引时,也可以指定一个填充值:
df1.reindex(columns=df2.columns, fill_value=0)
   a  b  c  d  e
0  0  0  1  2  0
1  0  3  4  5  0
2  0  6  7  8  0
加减乘除:add、sub、mul、div
DataFrame和Series之间的运算
先看个例子:
arr = np.arange(12).reshape((3,4))

arr
[[ 0  1  2  3]
 [ 4  5  6  7]
 [ 8  9 10 11]]

arr[0]
[0 1 2 3]

arr - arr[0]
[[0 0 0 0]
 [4 4 4 4]
 [8 8 8 8]]
发现所有的维度都被减了,这个就是广播。
frame = DataFrame(np.arange(12).reshape((4,3)), columns=list('bcd'),
                  index=['Utah', 'Ohio','Texas','Pregon'])
series = frame.ix[0]

frame
        b   c   d
Utah    0   1   2
Ohio    3   4   5
Texas   6   7   8
Pregon  9  10  11

series
b    0
c    1
d    2
Name: Utah, dtype: int32

frame - series
        b  c  d
Utah    0  0  0
Ohio    3  3  3
Texas   6  6  6
Pregon  9  9  9
# 行广播运算
如果某个索引值在DataFrame的列或Series的索引中找不到,则参与运算的两个对象就会被重新索引以形成并集
series2 = Series(range(3), index=['b','c','f'])

frame+series2
          b     c   d   f
Utah    0.0   2.0 NaN NaN
Ohio    3.0   5.0 NaN NaN
Texas   6.0   8.0 NaN NaN
Pregon  9.0  11.0 NaN NaN
如果希望匹配行,且在列广播,就必须用算术云算法。
series3 = frame['d']
series3

Utah       2
Ohio       5
Texas      8
Pregon    11
Name: d, dtype: int32

frame.sub(series3, axis=0)
        b  c  d
Utah   -2 -1  0
Ohio   -2 -1  0
Texas  -2 -1  0
Pregon -2 -1  0
函数的应用和映射
NumPy的ufuncs(元素级数组方法)也可用于操作pandas对象:
frame = DataFrame(np.random.randn(4,3), columns=list('bcd'),
                  index=['Utah', 'Ohio','Texas','Pregon'])
np.abs(frame)

               b         c         d
Utah    1.953494  1.379303  0.338753
Ohio    1.142983  0.953289  0.843422
Texas   0.557409  1.798355  1.019692
Pregon  0.193954  1.787517  0.723089
另一个常见操作是,将函数应用到各列或行所形成的一维数组上。DataFrame的apply方法可以实现
f = lambda x:x.max() - x.min()
frame.apply(f,axis=1)

Utah      2.339517
Ohio      1.089608
Texas     1.393819
Pregon    1.881294
dtype: float64

frame.apply(f)
b    1.214805
c    2.756908
d    1.997903
dtype: float64
传递给apply的函数还可以返回多个值组成的Series:
def foo(x):
    return Series([x.min(), x.max()], index=['min', 'max'])

frame.apply(foo)
            b        c         d
min -0.343971 -2.44858 -1.736360
max  1.113326  0.96367  0.067587
此外,元素级的python函数也是可以用的。假如你想得到frame中各个浮点值的格式化字符串
format = lambda x: '%.2f' % x

frame.applymap(format)
            b      c      d
Utah    -0.26  -0.59   0.93
Ohio     0.01  -0.28   0.37
Texas    0.40  -1.32  -0.55
Pregon   0.20  -1.07   0.04
之所以叫做applymap是因为Series有一个用于应用元素级函数的map方法:
frame['d'].map(format)
Utah      -0.67
Ohio       0.14
Texas      0.11
Pregon    -0.72
Name: d, dtype: object
排序和排名
1、索引排序
sort_index 行排序,默认是升序排序的。
对于dataframe而言可以对任意一个轴上的索引排序:
frame.sort_index(axis=1) # 列排序
frame.sort_index(axis=1,ascending=False)
# sort_index已经存在一个future warning,后续将不在支持,转而使用sort_values方法
2、值排序
Series直接用order() # order在新版本已经不存在可以使用sort_vaues来代替
obj.order() # 任何缺失值都会被放到Series的末尾
在DataFrame上,你可能希望根据一个或者多个列排序。我们通过把一个或多个列的列名传递给by即可达到目的:
frame.sort_index(by='column1')
frame.sort_index(by=['column1', 'column2'])
3、排名(ranking)
排名跟排序关系密切,且它会增设一个排名值,从1开始,一直到数组中有效数据的数量。它跟numpy.argsort产生的间接排序索引差不多,只不过它可以根据某种规则破坏平级关系。Series和DataFrame的rank方法在默认情况下,rank是通过为各组分配一个平均排名的方式破坏平级关系。
obj = Series([7,-5,7,4,2,0,4])
obj.rank()
0    6.5
1    1.0
2    6.5
3    4.5
4    3.0
5    2.0
6    4.5
dtype: float64
也可以根据值在原始数据中出现的顺序给出排名:
obj.rank(method='first')
0    6.0
1    1.0
2    7.0
3    4.0
4    3.0
5    2.0
6    5.0
dtype: float64
也可以按降序进行排名:
obj.rank(ascending=False, method='max')
0    2.0
1    7.0
2    2.0
3    4.0
4    5.0
5    6.0
6    4.0
dtype: float64
DataFrame可以在行或者列上计算排名:
frame = DataFrame({'b':[4.3,7,-3,2]
                   ,'a':[0,1,0,1],
                   'c':[-2,5,8,-2.5]})
frame
   a    b    c
0  0  4.3 -2.0
1  1  7.0  5.0
2  0 -3.0  8.0
3  1  2.0 -2.5


frame.rank(axis=1)
   a    b    c
0  0  4.3 -2.0
1  1  7.0  5.0
2  0 -3.0  8.0
3  1  2.0 -2.5
 排名rank的

1 排名时用于破坏平级关系的method选项
2 average            默认:在相等分组中,为各个值分配平均排名
3 min                  使用整个分组的最小排名
4 max                 使用整个分组的最大排名
5 first                  按值在原始数据中的出现顺序分配排名
带有重复值的轴索引
之前介绍的所有范例都是唯一的轴标签,虽然pandas函数我们都要求标签唯一,但这并不是强制的。
obj = Series(range(5), index=['a','b','a','b','e'])
obj.index.is_unique

false
# index里面的is_unique属性可以检测唯一性

#获取值
obj['a']    2个
obj['e']    1个

dataframe的重复索引,会拉出满足索引的所有行。
frame.ix['b']
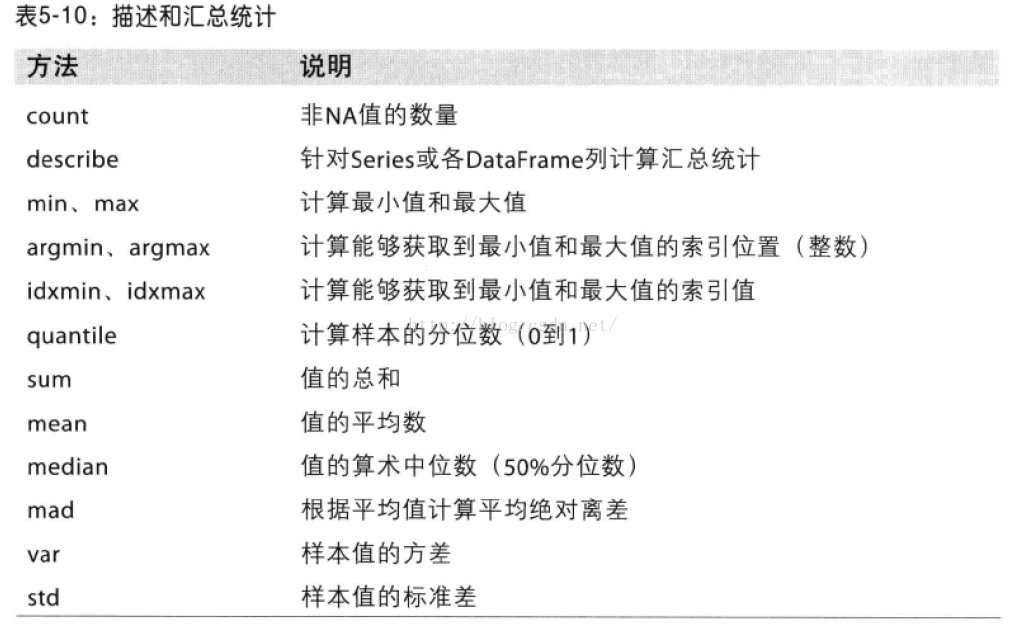
汇总和统计
frame = DataFrame([[1.4,np.nan],[7.1,-4],[np.nan,np.nan],[0.73,-1]],
index=['a','b','c','d'],
columns=['one','two'])
frame.sum()
one 9.23
two -5.00
dtype: float64
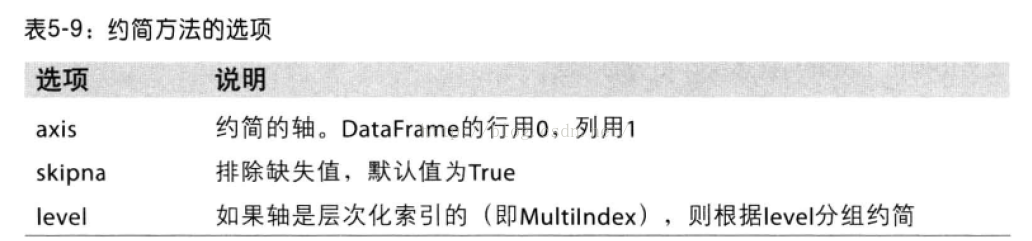
#sum函数将返回一个含有列小计的series,默认axis=0
frame.sum(axis=1)
a 1.40
b 3.10
c 0.00
d -0.27
dtype: float64、
#不忽略NA值
frame.mean(axis=1, skipna=False)
a NaN
b 1.550
c NaN
d -0.135
dtype: float64
间接统计
frame.idxmax()
one    b
two    d
dtype: object

frame.cumsum()
    one  two
a  1.40  NaN
b  8.50 -4.0
c   NaN  NaN
d  9.23 -5.0

# describe针对数值型
frame.describe()
            one      two
count  3.000000  2.00000
mean   3.076667 -2.50000
std    3.500376  2.12132
min    0.730000 -4.00000
25%    1.065000 -3.25000
50%    1.400000 -2.50000
75%    4.250000 -1.75000
max    7.100000 -1.00000

# describe针对于非数值型
obj = Series(['a','a','b','c']*4)
obj.describe()
count     16
unique     3
top        a
freq       8
dtype: object
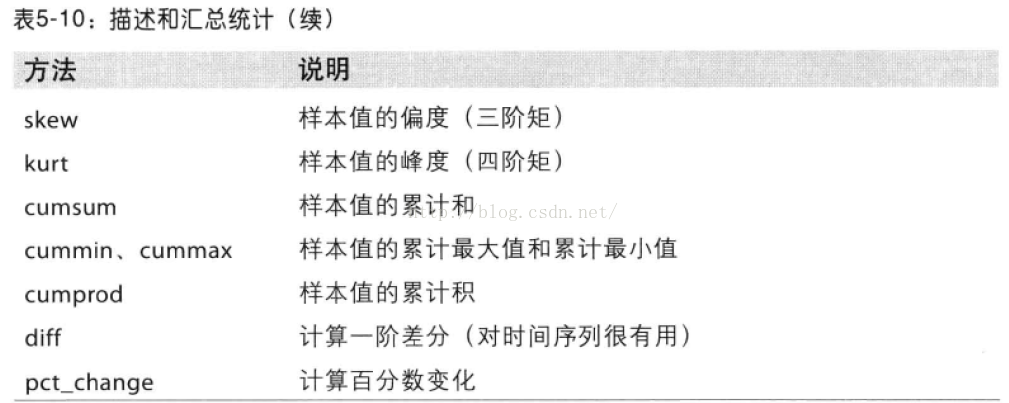
相关系数与协方差
# 计算价格的百分数变化
frame_returns = frame.pct_change()

frame_returns.tail()  # 返回末尾的5行

#Seriesde corr方法用于计算两个Series中的重叠的,非NA的,按索引对齐的值的相关系数。cov用于计算协方差。
frame_returns['a'].corr(frame_returns['b'])
frame_returns['a'].cov(frame_returns['b'])

#dataframe的 corr和cov方法将以dataframe的形式返回完整的相关系数或协方差矩阵:
frame_returns.corr()
frame_returns.cov()

#dataframe的corrwith方法,可以用来计算其列或行跟另一个Series或dataframe之间的相关系数。传入一个series将会返回一个相关系数值Series
frame_returns.corrwith(frame_returns['a'])

#传入一个dataframe则会计算按列名配对的相关系数。
frame_returns.corrwith(frame1)
唯一值,值计数以及成员资格
obj = Series(['c','a','b','a','c','b','a','b','c','d'])
unique = obj.unique()

unique
['c' 'a' 'b' 'd']

sorted(unique)
['a', 'b', 'c', 'd']

#统计series中各个值出现的频率,默认降序
c    3
b    3
a    3
d    1
dtype: int64

#value_counts还是一个顶级的pandas方法,可以用于任何数组和序列:
pd.value_counts(obj.values, sort=False)

# isin用来判断矢量化集合的成员资格。
mask = obj.isin(['b','c'])
0     True
1    False
2     True
3    False
4     True
5     True
6    False
7     True
8     True
9    False
dtype: bool

obj[mask]
0    c
2    b
4    c
5    b
7    b
8    c
dtype: object
有时希望得到dataframe中多个相关列的一个柱状图。
data = DataFrame({'q1':[1,2,2,4,5],
                  'q2':[2,3,4,4,6],
                  'q3':[3,4,5,7,1]})
这时我们可以联想到一个apply函数,可以接收方法函数:
result = data.apply(pd.value_counts).fillna(0)
result
    q1   q2   q3
1  1.0  0.0  1.0
2  2.0  1.0  0.0
3  0.0  1.0  1.0
4  1.0  2.0  1.0
5  1.0  0.0  1.0
6  0.0  1.0  0.0
7  0.0  0.0  1.0
缺失数据处理
NaN:pandas使用浮点值NaN表示浮点和非浮点数组中的缺失数据。它只是一个便于被检测出来的标记而已:
string_data.isnull()
Python内置的None值也会被当做NA处理。
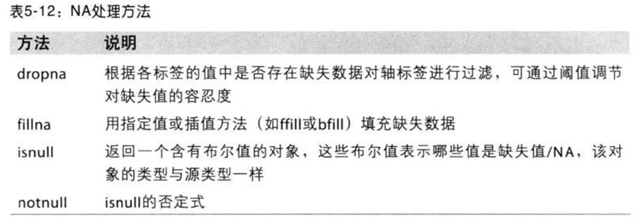
滤除缺失数据
Series
data = Series([1,NA,3.8,NA,9])

data.dropna()
0    1.0
2    3.8
4    9.0
dtype: float64

# 也可以用索引来取值,True
data[data.notnull()]
0    1.0
2    3.8
4    9.0
dtype: float64
DataFrame就有点复杂了,因为是多维的所以必须考虑维度了。你可能会考虑丢弃全NA的行或者列。
data = DataFrame([[1,6.5,7],[1,NA,5],[NA,NA,NA],[NA,6.5,3]])
cleaned = data.dropna()
cleaned
     0    1    2
0  1.0  6.5  7.0

# 只丢弃全NA的行
data.dropna(how='all')

# 组合
data.dropna(axis=1,how='all')
另一个滤除DataFrame行的问题设计时间序列数据。假设你只想留下一部分观测数据可以用thresh参数实现此目的:至少要有thresh个非NA值
df = df.DataFrame(np.random.randn(7, 3))
df.ix[:4, 1] = NA; df.ix[:2, 2] = NA
df
 0         1         2
0 -0.776521       NaN       NaN
1 -1.179873       NaN       NaN
2 -0.479620       NaN       NaN
3 -0.214146       NaN -0.387709
4  0.864021       NaN -1.198854
5 -1.654861 -1.367580 -1.010236
6  0.454499  0.938988 -0.511850

df.dropna(thresh=3)
0         1         2
5 -1.654861 -1.367580 -1.010236
6  0.454499  0.938988 -0.511850
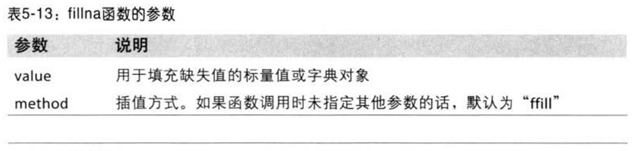
缺失数据的填充
fillna方法将缺失值替换为常数值:
df.fillna(0)
不同的列填不同的值:
frame.fillna({1:0.5,2:-2})
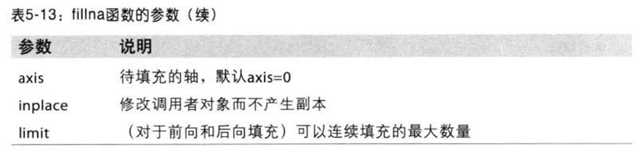
fillna默认会返回新对象,但也可以对现有对象进行就地修改:
frame.fillna(0,inplace=True)
总是返回被填充对象的引用。
对于reindex有效的那些插值方法也可用于fillna:
frame.fillna(method='ffill',limit=2)
#限制只能向前填充2个
思维活跃一点,我们可以向空的地方传入平均值,中位数
data.fillna(data.mean())
层次化索引
pandas的一项重要功能,它使你能在一个轴上拥有多个索引级别,它使你能以低纬度形式处理高纬度数据
data = Series(np.random.randn(10),
              index=[['a','a','a','b','b','b','c','c','d','d'],
              [1,2,3,1,2,3,1,2,2,1]])
data
a  1   -0.165922
   2   -0.138976
   3    0.007587
b  1    0.335639
   2    1.629216
   3   -0.480855
c  1   -2.172897
   2   -0.171582
d  2   -0.289778
   1   -2.916143
dtype: float64
这就是带有multiIndex索引的格式化输出形式。索引之间的间隔表示直接使用上面的标签:
data.index
MultiIndex(levels=[['a', 'b', 'c', 'd'], [1, 2, 3]],
           labels=[[0, 0, 0, 1, 1, 1, 2, 2, 3, 3], [0, 1, 2, 0, 1, 2, 0, 1, 1, 0]])
层次化索引对象,选取数据子集的操作很简单:
data['b']
1    0.247669
2    0.975361
3   -0.308308
dtype: float64

data['b':'c']
b  1    1.163305
   2    0.815069
   3   -0.154085
c  1   -0.912454
   2    0.705557
dtype: float64

data.ix[['b','d']]
b  1    1.757426
   2   -0.150988
   3    0.222278
d  2    0.602902
   1   -0.388132
dtype: float64

#所有一级轴内的,二级索引中的2
data[:,2]
a   -0.858922
b    0.292737
c    1.174298
d   -0.037061
dtype: float64
层次化索引数据重塑与分组
data.unstack()
          1         2         3
a  1.159234 -0.429165 -0.625657
b -0.279153  1.500612  1.306801
c -0.517813  0.694927       NaN
d  0.442514 -0.012561       NaN

data.unstack().stack()  # unstack的逆运算是stack
DataFrame每条轴上都可以分层索引:
frame = DataFrame(np.arange(12).reshape((4,3)),
                  index=[['a','a','b','b'],[1,2,1,2]],
                  columns=[['ohio','ohio','LA'],['green','ren','yellow']])
frame
     ohio         LA
    green ren yellow
a 1     0   1      2
  2     3   4      5
b 1     6   7      8
  2     9  10     11

frame.index.names=['key1','key2']
frame.columns.names = ['state','color']
state      ohio         LA
color     green ren yellow
key1 key2
a    1        0   1      2
     2        3   4      5
b    1        6   7      8
     2        9  10     11
有了分部的索引,就可以轻松选取索引分组了
frame['ohio']
重新分级排序
frame.swaplevel('key1','key2')
state      ohio         LA
color     green ren yellow
key2 key1
1    a        0   1      2
2    a        3   4      5
1    b        6   7      8
2    b        9  10     11

# sortlevel根据单个级别中的值对数据进行排序。交换级别时,常常也会伴随着sortlevel,这样结果就有序了。
frame.sortlevel(1)
state      ohio         LA
color     green ren yellow
key1 key2
a    1        0   1      2
b    1        6   7      8
a    2        3   4      5
b    2        9  10     11

frame.swaplevel(0,1).sortlevel(0)
state      ohio         LA
color     green ren yellow
key2 key1
1    a        0   1      2
     b        6   7      8
2    a        3   4      5
     b        9  10     11
根据级别汇总统计
frame.sum(level='key2')
state  ohio         LA
color green ren yellow
key2
1         6   8     10
2        12  14     16

frame.sum(level='color',axis=1)
color      green  ren  yellow
key1 key2
a    1         0    1       2
     2         3    4       5
b    1         6    7       8
     2         9   10      11
dataframe的列转行索引:
frame2 = frame.set_index(['c','d'])
frame2
       a  b
c   d
one 0  0  7
    1  1  6
    2  2  5
two 0  3  4
    1  4  3
    2  5  2
    3  6  1

# 默认列会被删除,也可以保留
frame2 = frame.set_index(['c','d'],drop=False)
frame2
       a  b    c  d
c   d
one 0  0  7  one  0
    1  1  6  one  1
    2  2  5  one  2
two 0  3  4  two  0
    1  4  3  two  1
    2  5  2  two  2
    3  6  1  two  3

frame2.reset_index()
     c  d  a  b
0  one  0  0  7
1  one  1  1  6
2  one  2  2  5
3  two  0  3  4
4  two  1  4  3
5  two  2  5  2
6  two  3  6  1
其他有关pandas的话题
整数索引
首先,看一个实例,下面的代码会输出什么
ser = Series(np.arange(3))
ser[-1]
从python切片的角度,应该输出ser的最后一位。但在这种情况下,虽然pandas会‘求助于整数索引’,但没有哪种方法能够既不引入任何的bug又安全有效的解决该问题。因为本身存在0,1,2的索引,所以很难推断出用户想要什么。
然而对于一个非整数索引,就没有这样的歧义:
ser2 = Series(np.arange(3),index=['a','b','c'])
ser2[-1]
2
ix方法现在已经被loc和iloc方法取代,在dataframe里面,irow同理也是被loc和iloc取代。
loc是label索引, iloc是位置索引
看个简单的示例

面板数据
对于多维的dataframe用.to_frame()呈现面板数据。to_panel方法是to_frame的逆运算。
看书吧,。。159页,这个真不会忽悠人。