使用yum安装grafana
[root@centos-172-16-1-10 ~]# vim /etc/yum.repos.d/grafana.repo
[grafana]
name=grafana
baseurl=https://packages.grafana.com/oss/rpm
repo_gpgcheck=1
enabled=1
gpgcheck=1
gpgkey=https://packages.grafana.com/gpg.key
sslverify=1
sslcacert=/etc/pki/tls/certs/ca-bundle.crt

[root@centos-172-16-1-10 ~]# yum install -y grafana
配置LDAP登入
# 开启ldap
[root@centos-172-16-1-10 ~]# vim /etc/grafana/grafana.ini
[auth.ldap]
enabled = true
config_file = /etc/grafana/ldap.toml
allow_sign_up = true

# 配置ldap
[root@centos-172-16-1-10 ~]# grep -Ev "^#|^$" /etc/grafana/ldap.toml
[[servers]]
host = "xx.xx.xx.xx"
port = 389
use_ssl = false
start_tls = false
ssl_skip_verify = false
bind_dn = "uid=si,ou=user,dc=xxx,dc=cn"
bind_password = '******'
search_filter = "(&(isDeleted=false)(isEnabled=true)(status=1)(userName=%s))"
search_base_dns = ["ou=People,dc=xxx,dc=cn"]
[servers.attributes]
name = "cn"
surname = "title"
username = "userName"
member_of = "memberOf"
email = "userName"
启动grafana
[root@centos-172-16-1-10 ~]# systemctl start grafana-server.service
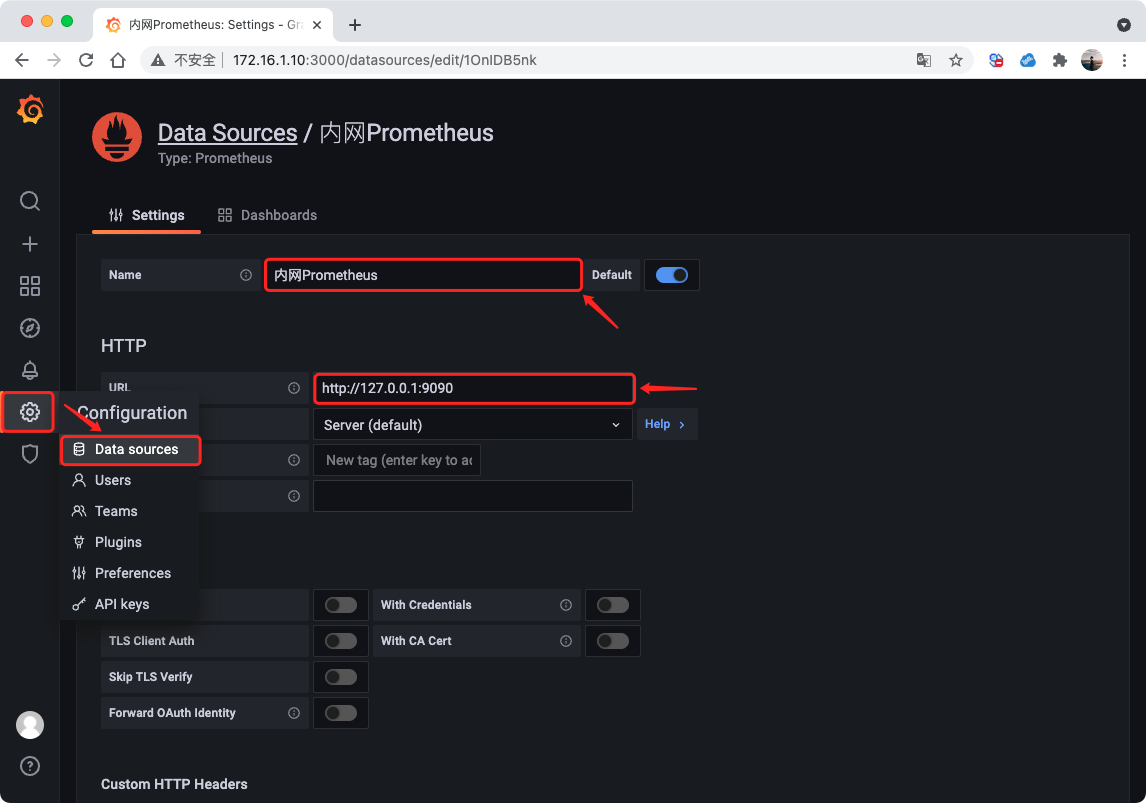
[root@centos-172-16-1-10 ~]# systemctl enable grafana-server.service配置Grafana接入Prometheus数据源
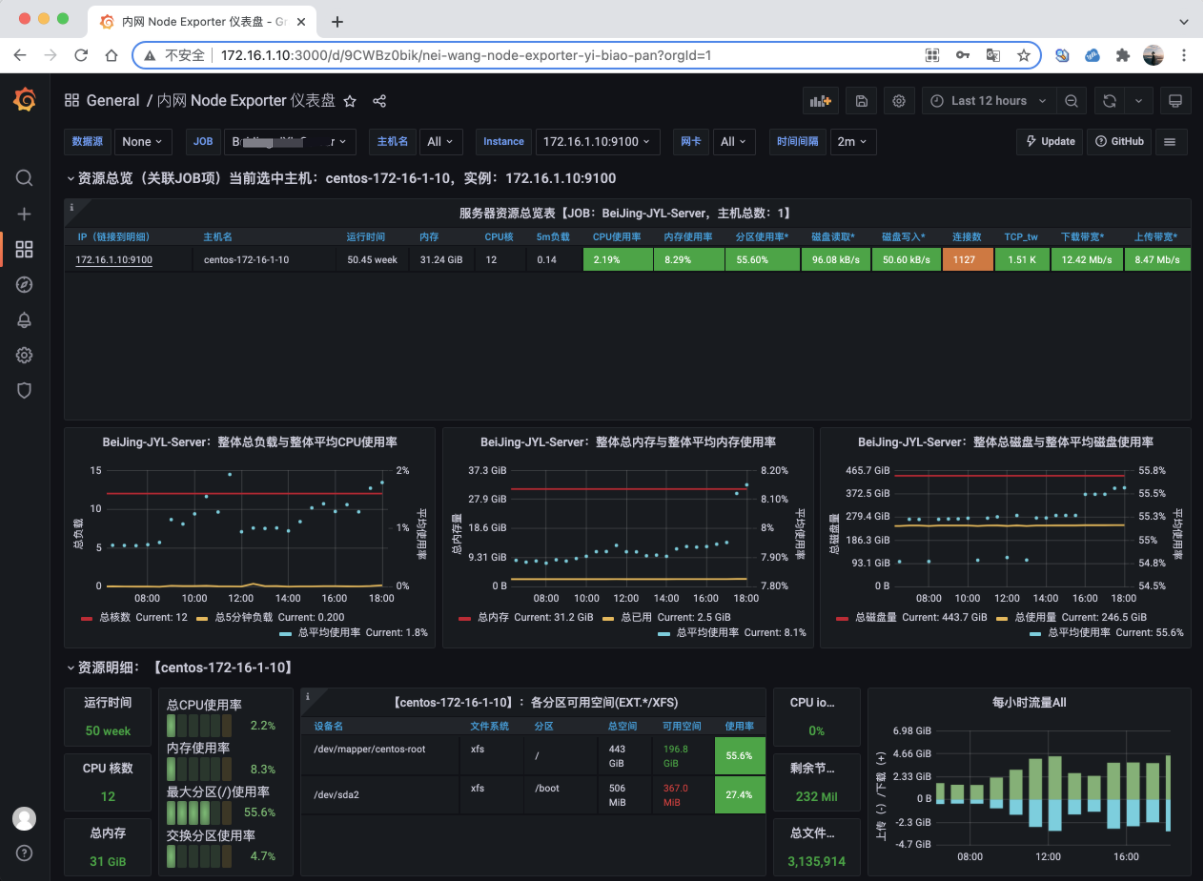
导入Grafana Dashboards模板
GitHub主页:https://github.com/starsliao/Prometheus
中文版本:https://grafana.com/grafana/dashboards/8919
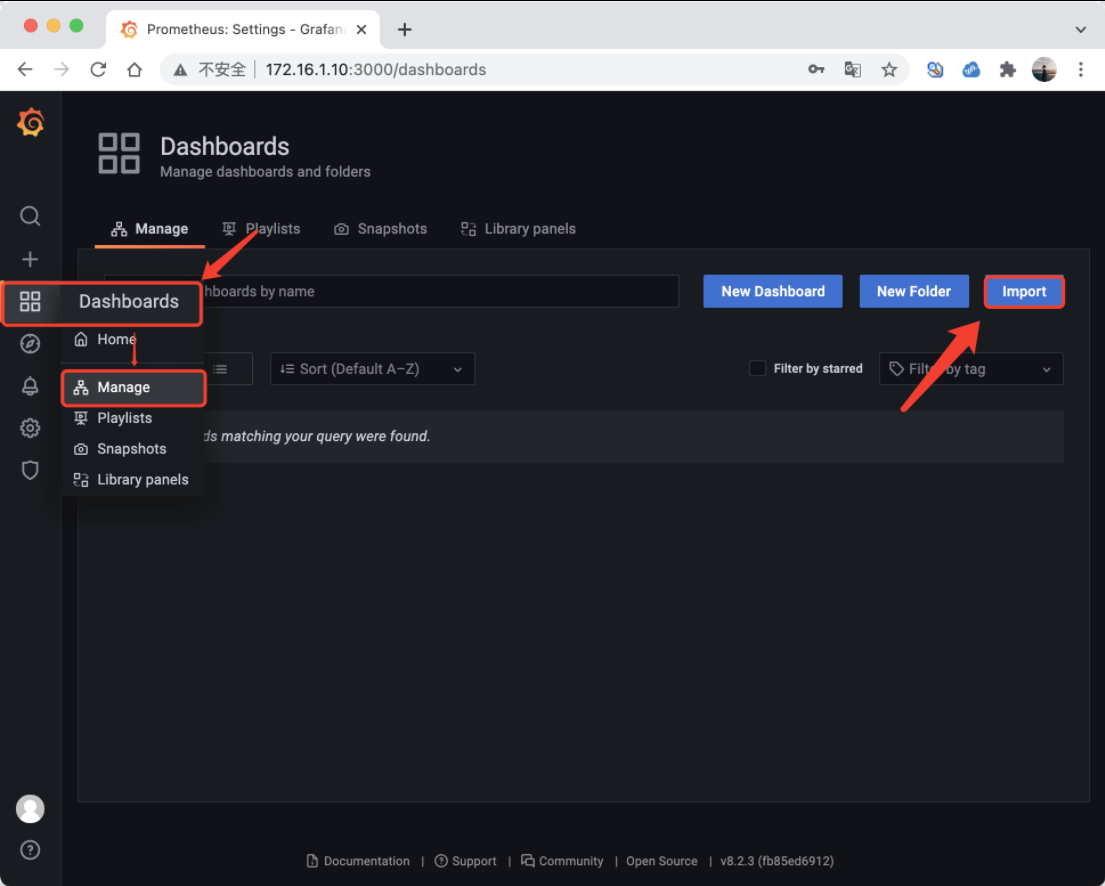
填入8919选择“本地Prometheus” 源并保存