vidia自带一个命令行工具可以查看显存的使用情况:
nvidia-smi
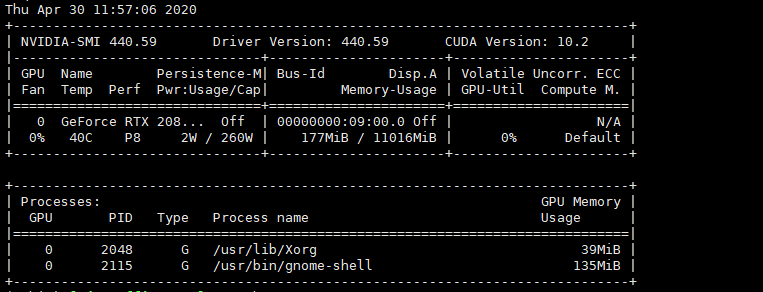
表头释义:
- Fan:显示风扇转速,数值在0到100%之间,是计算机的期望转速,如果计算机不是通过风扇冷却或者风扇坏了,显示出来就是N/A;
- Temp:显卡内部的温度,单位是摄氏度;
- Perf:表征性能状态,从P0到P12,P0表示最大性能,P12表示状态最小性能;
- Pwr:能耗表示;
- Bus-Id:涉及GPU总线的相关信息;
- Disp.A:是Display Active的意思,表示GPU的显示是否初始化;
- Memory Usage:显存的使用率;
- Volatile GPU-Util:浮动的GPU利用率;
- Compute M:计算模式;
下边的Processes:
显示每块GPU上每个进程所使用的显存情况。
如果要周期性的输出显卡的使用情况,可以用watch指令实现:
watch -n 10 nvidia-smi
命令行参数-n后边跟的是执行命令的周期,以s为单位。
watch用法


用法:
 watch [options] command

选项:
  -b, --beep             beep if command has a non-zero exit
  -c, --color            interpret ANSI color and style sequences
  -d, --differences[=<permanent>]
                         highlight changes between updates
  -e, --errexit          exit if command has a non-zero exit
  -g, --chgexit          exit when output from command changes
  -n, --interval <secs>  seconds to wait between updates
  -p, --precise          attempt run command in precise intervals
  -t, --no-title         turn off header
  -x, --exec             pass command to exec instead of "sh -c"

 -h, --help     显示此帮助然后离开
 -v, --version  output version information and exit
完结!