vue echarts 实现速度的那种进度蓄力效果
这个标题写的我很纠结,因为我一个语言组织能力不咋地的人真的不知道该怎么描述这个效果,所以呢,就这样描述一下,希望各位可以理解我。
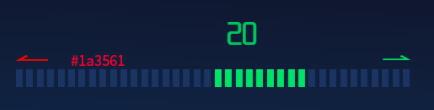
简单来说就是这种效果的啦!
其实这个效果是就是使用echarts的柱形图。简单的写一下option的样式,如果有需要的话就参考一下,仅供参考兄弟们!
let option = {
          grid: {
            top: '30%',
            bottom: '4%',
            left: '2%',
            right: '2%'
          },
          xAxis: {
            type: 'value',
            position: 'top',
            min: -50,
            max: 50,
            axisLine: { show: false },
            axisLabel: { show: false },
            axisTick: { show: false },
            splitLine: { show: false },
          },
          yAxis: {
            show: false,
            type: 'category',
            axisLine: { show: false },
            axisLabel: { show: false },
            axisTick: { show: false },
            splitLine: { show: false },
            data: [
              'one'
            ]
          },
          series: [
            {
              name: '',
              type: 'pictorialBar',
              symbol: 'rect', // 类型
              label: {
                normal: {
                  position: 'right',
                }
              },
              symbolRepeat: true,
              symbolSize: [6, 20],

              data: [
                {
                  value: -50,
                  label: this.labelRight,
                  itemStyle: {
                    color: '#d9030e27'
                  },
                },
                {
                  value: 50, itemStyle: {
                    color: '#00e2691a'
                  }
                },
              ]
            },
            { //分隔
              type: 'pictorialBar',
              symbolRepeat: 'fixed',
              symbol: 'Rect',
              symbolClip: true,
              symbolSize: [6, 20],
              data: [
                {
                  value:0,
                  itemStyle: {
                    color: '#d9030e'
                  },
                },
                {
                  value: 20,
                  itemStyle: {
                    color: '#00e268'
                  }
                },
              ]
            },
          ]
        };
效果就是这个样子。

加油!