转:https://uqer.io/home/
https://uqer.io/community/share/564c3bc2f9f06c4446b48393
写在前面
-
9月的时候说想把arch包加进去,昨儿发现优矿已经加好了,由于优矿暂时没有开放历史高频接口,我索性就分享一个冷冷的小知识:分形市场假说(FMH),分析中玩的是低频数据(日线,或者分钟线)。
-
所谓分形市场假说,就是人们发现有效市场假说的种种不合理后,提出的一种假说,我曾经有仔细关注过这一块,因为这个假说真是太「中国特色」了:
-
它有几个主要论点:
- 当市场是由各种投资期限的投资者组成时,市场是稳定的(长期投资者和短期投资者),当投资者单一时,则市场会出流动性问题;
- 信息集对基本分析和技术分析来讲短期影响比长期影响要大;
- 当某一事件的出现使得基础分析的有效性值得怀疑时,长期投资者或者停止入市操作或者基于短期信息进行买卖;
- 价格是短期技术分析和长期基础分析的综合反应;
- 如果某种证券与经济周期无关,那么它本身就不存在长期趋势。此时,交易行为、市场流动性和短期信息将占主导地位。
- 总之就是一个具有「正反馈、非线性、分形、混沌、耗散」等等很牛逼的概念,深深吸引着曾经学过物理学的我。。。
关于Hurst指数以及MF-DFA
-
现在对于分形市场假说的主要方法论就是 Hurst指数,通过MF-DFA(Multifractal detrended fluctuation analysis)来计算, 具体的可以维基百科一下,大体就是当hurst>0.5时时间序列是一个persistent的过程,当hurst>0.5时时间序列是一个anti-persistent的过程,当hurst=0.5时间序列是一个不存在记忆的随机游走过程。
-
而在实际计算中,不会以理论值0.5作为标准(一般会略大于0.5)
写在最后
- 这份工作来自于LADISLAV KRISTOUFEK这位教授在12年的工作,论文名叫做RACTAL MARKETS HYPOTHESIS AND THE GLOBAL FINANCIAL CRISIS: SCALING, INVESTMENT HORIZONS AND LIQUIDITY
- 这位教授后来在13年把这项工作强化了一下(加了点小波的方法),把论文的图画得美美哒,竟然发表在了Nature的子刊Scientific Report上。当年我的导师发了一篇SR可是全校通报表扬啊,虽然现在我以前在物理系的导师说今年有4篇SR发表。。
- 总之,如果谁对这个感兴趣,或者想在Nature上水一篇文章,可以研究研究。
- 这个方法对设计策略有没有什么用? 好像没有用哎,所以我发表在「研究」板块里了哈。不过10年海通有研究员测试过根据这个方法写的策略,据说alpha还不错。
- 算法部分我用的是自己的library库。
import numpy as np
import pandas as pd
from arch import arch_model # GARCH(1,1)
from matplotlib import pyplot as plt
from datetime import timedelta
from CAL.PyCAL import *
from lib.Hurst import *

inter = 320 #滑动时间窗口
#设置时间
today = Date.todaysDate()
beginDate = '20100101'
endDate = today.toDateTime().strftime('%Y%m%d')

#设置指数类型
indexLabel = '000001' # SSE index
#indexLabel = '399006' # CYB index

#读取指数
indexPrice = DataAPI.MktIdxdGet(ticker=indexLabel,beginDate=beginDate,endDate=endDate,field=["tradeDate","closeIndex"],pandas="1")
price = np.array(indexPrice.loc[:,'closeIndex'])

#计算对数收益
back_price = np.append(price[0],price.copy())
back_price = back_price[:-1]
return_price = np.log(price) - np.log(back_price)

#计算波动率 from GARCH(1,1)
am = arch_model(return_price)
res = am.fit()
sqt_h = res.conditional_volatility

#去除波动性
f = return_price/sqt_h

#计算hurst指数,函数来自自定义library
hurst = Hurst(f,T=inter,step=1,q=2,Smin=10,Smax=50,Sintr=1)

indexPrice['Hurst'] = pd.DataFrame(np.array([0] * len(indexPrice)))
indexPrice.loc[inter-1:,'Hurst'] = hurst
indexPrice.index = indexPrice['tradeDate']
plt.figure(figsize=(10,6))
plt.subplot(3,1,1)
plt.plot(f)
plt.subplot(3,1,2)
plt.plot(return_price)
plt.subplot(3,1,3)
plt.plot(sqt_h)
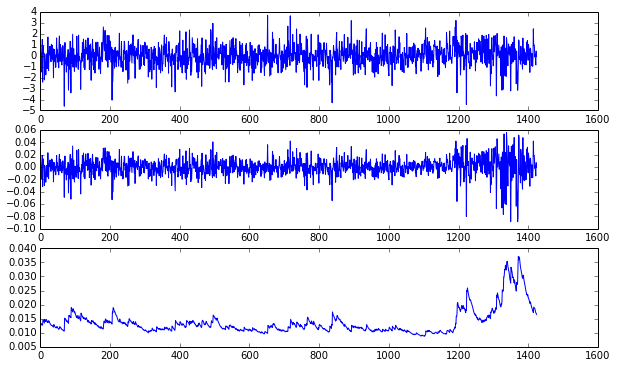
上面的图能够看到garch(1,1)到底做了什么,它主要是对波动率进行了建模,在做分析时消去了这部分的影响。
plt.figure(1)
indexPrice['closeIndex'].tail(len(indexPrice)-inter).plot(figsize=(10,4),color='red',title='SSE Index',linewidth=1)
plt.figure(2)
indexPrice['Hurst'].tail(len(indexPrice)-inter).plot(figsize=(10,4),color='green',title='Hurst Index',linewidth=1,marker='.')
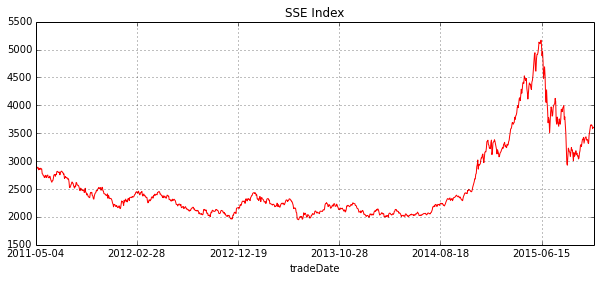

- 看出了啥没?简单点说,就是hurst越大,越有可能延续之前的趋势(即动量),若hurst越小,则越有可能违反之前的趋势(即反转)。LADISLAV KRISTOUFEK这位教授的想法是通过极大极小值来判断,当然它分析的是美股啦。
- 再看看上面的图,是对上证指数的分析,取的是日线的数据(其实我喜欢用分钟线,因为A股波动辣么牛逼,日线颗粒度哪里够啊。。),可以得(meng)出这些结论:
- 13年中旬hurst出现最小值,说明熊市的跌势要反转了,马上要进入牛市了?!
- 15年中旬hurst出现最小值,说明牛市的涨势要反转了,马上要进入熊市了?!
- 算卦完毕。
看到好多人在克隆这份东西,我索性就把自定义的lib分享出来,仅限学术交流。命名为Hurst并添加到library即可。
#coding=utf-8

import numpy as np
from sklearn.linear_model import LinearRegression

def avgFluctuation(Xseries,q,S):
    lr = LinearRegression(fit_intercept = True)
    T = Xseries.shape[0]
    Ts = int(T/S)
    qorder = q
    aFlu = 0
    Xtime = np.array(range(1,S+1))
    Xtime.shape = (S,1)
    for v in range(1,Ts+1):
        Xstarts = (v-1)*S
        Xends = v*S
        Xtemp = Xseries[Xstarts:Xends]
        Xtemp.shape = (S,1)
        lr.fit(Xtime,Xtemp)
        fitX = map(lr.predict,Xtime)
        eX = fitX - Xtemp
        Flu = np.sum(eX*eX)/S
        aFlu += (Flu)**(qorder/2)/(2*Ts)
    for v in range(Ts+1,2*Ts+1):
        Xstarts = T-(v-Ts)*S
        Xends = T-(v-Ts)*S+S
        Xtemp = Xseries[Xstarts:Xends]
        Xtemp.shape = (S,1)
        lr.fit(Xtime,Xtemp)
        fitX = map(lr.predict,Xtime)
        eX = fitX - Xtemp
        Flu = np.sum(eX*eX)/S
        aFlu += (Flu)**(qorder/2)/(2*Ts)
    aFlu = aFlu**(1./qorder)
    return aFlu

def MFDFA(Xseries,q,Smin,Smax,Sintr=1):
    T = Xseries.shape[0]
    N = (Smax - Smin + 1)/Sintr
    aFlus = np.zeros(N)
    i = 0
    for S in range(Smin,Smax+1,Sintr):
        aFlus[i] = avgFluctuation(Xseries,q,S)
        i += 1
    logaFlus = np.log(aFlus)
    logS = np.log(range(Smin,Smax+1,Sintr))
    lr = LinearRegression(fit_intercept = True)
    logaFlus.shape = (N,1)
    logS.shape = (N,1)
    lr.fit(logS,logaFlus)
    h = lr.coef_
    return h

def Hurst(X,T=300,step=1,q=2,Smin=10,Smax=50,Sintr=1):
    X = np.array(X)
    nX = X.shape[0]
    hurst = np.zeros(nX-T+1)
    for i in range(0,nX-T+1,step):
        XX = X[i:i+T]
        Xseries = np.zeros(T)
        for j in range(T):
            Xseries[j] = np.sum(XX[0:j+1])
        hurst[i] = MFDFA(Xseries,q,Smin,Smax,Sintr)
    return hurst
由于上面的代码运行有点问题,下面是我自己改过的代码:
def avgFluctuation(Xseries, q, S):
    lr = LinearRegression(fit_intercept = True)
    T = Xseries.shape[0]
    Ts = int(T/S)
    qorder = q
    aFlu = 0
    Xtime = np.array(range(1, S+1))
    Xtime.shape = (S, 1)
    for v in range(1, Ts+1):
        Xstarts = (v-1)*S
        Xends = v*S
        Xtemp = Xseries[Xstarts:Xends]
        Xtemp.shape = (S, 1)
        lr.fit(Xtime, Xtemp)
        fitX = list(map(lr.predict, [Xtime]))
        eX = fitX - Xtemp
        Flu = np.sum(eX*eX) / S
        aFlu += (Flu)**(qorder/2) / (2*Ts)
    for v in range(Ts+1,2*Ts+1):
        Xstarts = T-(v-Ts)*S
        Xends = T-(v-Ts)*S+S
        Xtemp = Xseries[Xstarts:Xends]
        Xtemp.shape = (S,1)
        lr.fit(Xtime,Xtemp)
        fitX = list(map(lr.predict, [Xtime]))
        eX = fitX - Xtemp
        Flu = np.sum(eX*eX) / S
        aFlu += (Flu)**(qorder/2) / (2*Ts)
    aFlu = aFlu**(1./qorder)
    return aFlu

def MFDFA(Xseries, q, Smin, Smax, Sintr=1):
    T = Xseries.shape[0]
    N = int((Smax - Smin + 1) / Sintr)
    aFlus = np.zeros(N)
    i = 0
    for S in range(Smin, Smax+1, Sintr):
        aFlus[i] = avgFluctuation(Xseries, q, S)
        i += 1
    logaFlus = np.log(aFlus)
    logS = np.log(range(Smin, Smax+1, Sintr))
    lr = LinearRegression(fit_intercept = True)
    logaFlus.shape = (N,1)
    logS.shape = (N,1)
    lr.fit(logS, logaFlus)
    h = lr.coef_
    return h

def Hurst(X, T=300, step=1, q=2, Smin=10, Smax=50, Sintr=1):
    X = np.array(X)
    nX = X.shape[0]
    hurst = np.zeros(nX-T+1)
    for i in range(0, nX-T+1, step):
        XX = X[i:i+T]
        Xseries = np.zeros(T)
        for j in range(T):
            Xseries[j] = np.sum(XX[0:j+1])
        hurst[i] = MFDFA(Xseries, q, Smin, Smax, Sintr)
    return hurst