Symptom
SAP Support asked you to provide a collection of the relevant diagnosis files (also known as "full-system-info-dump").
Environment
SAP HANA database, revision >=30
Resolution
You can collect the dump containing the diagnosis information either in HANA Studio or directly from the command line:
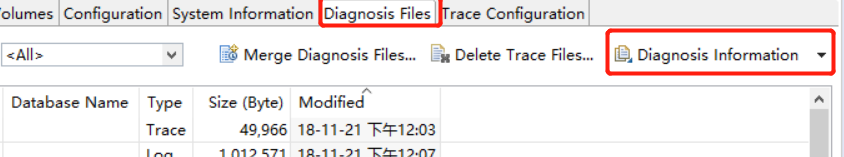
 1.In the Administration Editor in HANA Studio, choose the Diagnosis Files tab. If the system is offline, the Administration editor opens in diagnosis mode:
    1.1 Choose Diagnosis Information > Collect
1.2.Select whether System Views should be included (in earlier HANA revisions this option was offered in the step before by choosing "Collect with SQL" or "Collect without SQL) and the date range for
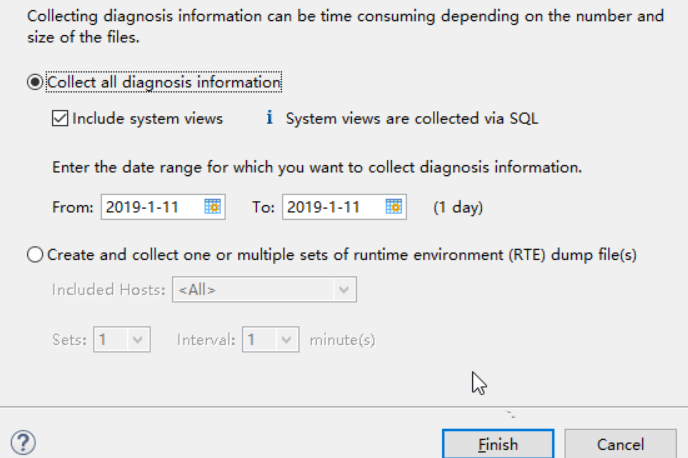
1.3.which you want to collect the diagnosis information.
1.4.Click the "Finish Button" to trigger the collection of diagnosis information
1.5.See below section 'Where to Download' to download the collection
- You are logged on as the operating system administrator
adm on the command line:
2.1Change to directory where the fullSystemInfoDump.py script is located (terminal shortcut "cdpy") i.e. $DIR_INSTANCE/exe/python_support
2.2For a database in a single-container system please execute: python fullSystemInfoDump.py [--days=<number_of_days>]
For a database in a multiple-container (MultiDb, MDC) system, you must also specify name of the tenant database with the corresponding option.
For a tenant database: python fullSystemInfoDump.py -t <TENANT_DATABASE_NAME> [--days=<number_of_days>]
For the system database: python fullSystemInfoDump.py -t SYSTEMDB [--days=<number_of_days>]
You are logged on to DBACOCKPIT
Go to Diagnostics/Diagnosis Files, in the upper task bar click "List Diagnosis Information" [Requires permissions "GRANT SELECT ON SYS.FULL_SYSTEM_INFO_DUMPS" (available in HANA Revision 101 and later), "EXECUTE on the procedure SYS.FULL_SYSTEM_INFO_DUMP", "EXECUTE on the procedure SYS.FULL_SYSTEM_INFO_DUMP_CREATE", "EXECUTE on the procedure SYS.FULL_SYSTEM_INFO_DUMP_RETRIEVE", "EXECUTE on the procedure SYS.FULL_SYSTEM_INFO_DUMP_DELETE"]
If systems views shall be included then the following permissions are required as well [SELECT on SYS_STATISTICS schema, SELECT on SYS_EPM schema, EXPORT privilege]
Go to Diagnostics/Diagnosis Files, in the upper task bar click "Generate RTE Dump" [Requires permission "GRANT Resource Admin]
Those features require the following SAP_BASIS Support Packages:
7.51 (all service packs)
7.50 (SP01 and higher)
7.40 (SP14 and higher)
7.31 (SP18 and higher)
7.30 (SP15 and higher)
7.02 (SP18 and higher)
Note: For storage reasons, by default only trace files of the last 7 days are collected unabridged (time range can be modified). In case the incident you would like to report happened more than 7 days ago, please make sure to include all the traces since the time of the occurrence by using the corresponding option "-d
See also the video below:
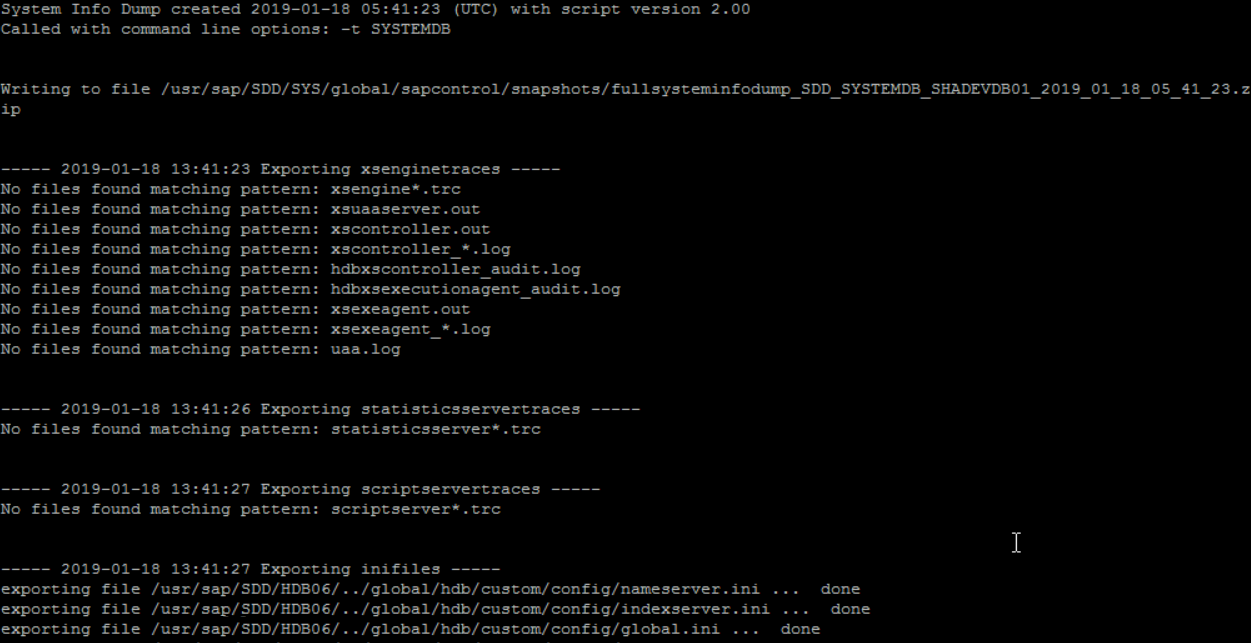
The collection represents a snapshot of the HANA database including:
The trace files of each host in the landscape i.e. $DIR_INSTANCE/
The database configuration files.
The backup logs, crashdump files & recorded performance trace files.
A runtime dump for each indexserver.
Among a set of other trace / configuration files, please refer to the documentation referenced for details
For storage reasons, by default only trace files from the last 7 days are collected unabridged (time range can be modified).
Where to Download
You can download the collection of diagnosis files (ZIP-archive having file name pattern fullsysteminfodump_
In the Administration Editor in HANA Studio, choose the Diagnosis Files tab, then select Diagnosis Information > List to download the full-system-info-dump.
Directly from the directory DIR_GLOBAL/sapcontrol/snapshots which typically points to /usr/sap/
As the size of the ZIP-archive created usually exceeds the maximum upload size of attachments in incidents, please:
Either request a SAP Mobile Documents or sFTP (see KBA 2077673) share from the Support Engineer for uploading the trace files.
Or transfer them to SAP using sapserv# ftp. See SAP Note 40024 for more details.
Additional information to avoid running into known problems:
Do not collect the full-system-info-dump from a standby host in distributed landscape when using SAP's Storage Connector (see SAP Note 2014225 for details).
For HANA revision 74.04 and lower please choose the command line option (see SAP Note 2040144 for details).
In rare cases and before HANA revision 80, the python call from the command line lead to high CPU usage. To limit the resources allocated by python, you can assign a lower priority to this process call by using "nice -19 python ...".