关于死锁其实在之前https://www.cnblogs.com/webor2006/p/10659938.html的jvm学习中已经详细举过例子了,不过这里再来复习一下,另外是从并发这个专题领域的角度再来看下它,这里先来阐述一下相关的概念:
死锁:线程1等待线程2互斥持有的资源,而线程2也在等待线程1互斥持有的资源,两个线程都无法继续执行。
活锁:线程持续重试一个总是失败的操作,导致无法继续执行。
饿死:线程一直被调度器延迟访问其赖以执行的资源,也许是调度器先于低优先级的线程而执行高优先级的线程,同时总是会有一个高优先级的线程可以执行,饿死也叫无限延迟。
以上是在Java并发中会遇到的三种情况,这次主要是来探讨死锁,先来编写一个死锁程序:
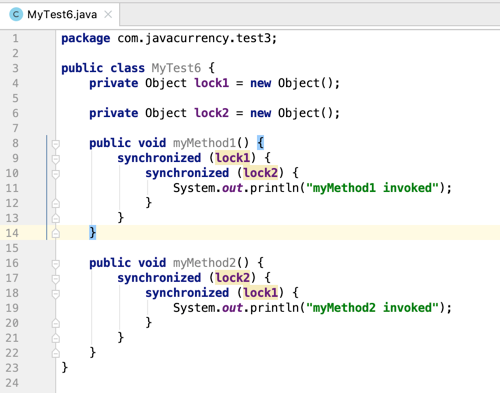
然后再创建线程调用一下:
public class MyTest6 {
    private Object lock1 = new Object();

    private Object lock2 = new Object();

    public void myMethod1() {
        synchronized (lock1) {
            synchronized (lock2) {
                System.out.println("myMethod1 invoked");
            }
        }
    }

    public void myMethod2() {
        synchronized (lock2) {
            synchronized (lock1) {
                System.out.println("myMethod2 invoked");
            }
        }
    }

    public static void main(String[] args) {
        MyTest6 myTest6 = new MyTest6();

        Runnable runnable1 = () -> {
            while (true) {
                myTest6.myMethod1();
                try {
                    Thread.sleep(100);
                } catch (InterruptedException e) {
                    e.printStackTrace();
                }
            }
        };

        Thread thread1 = new Thread(runnable1, "myThread1");

        Runnable runnable2 = () -> {
            while (true) {
                myTest6.myMethod2();
                try {
                    Thread.sleep(250);
                } catch (InterruptedException e) {
                    e.printStackTrace();
                }
            }
        };

        Thread thread2 = new Thread(runnable2, "myThread2");

        thread1.start();
        thread2.start();
    }
}
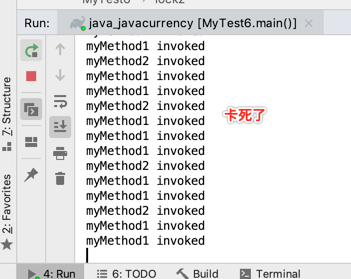
然后运行一段时间后,死锁就会出现了:
而到底是不是死锁了呢?可以采用jvisualvm工具可以进行死锁的检测,具体工具如何使用这里就不多说了,之前在JVM详细学习了,如下:
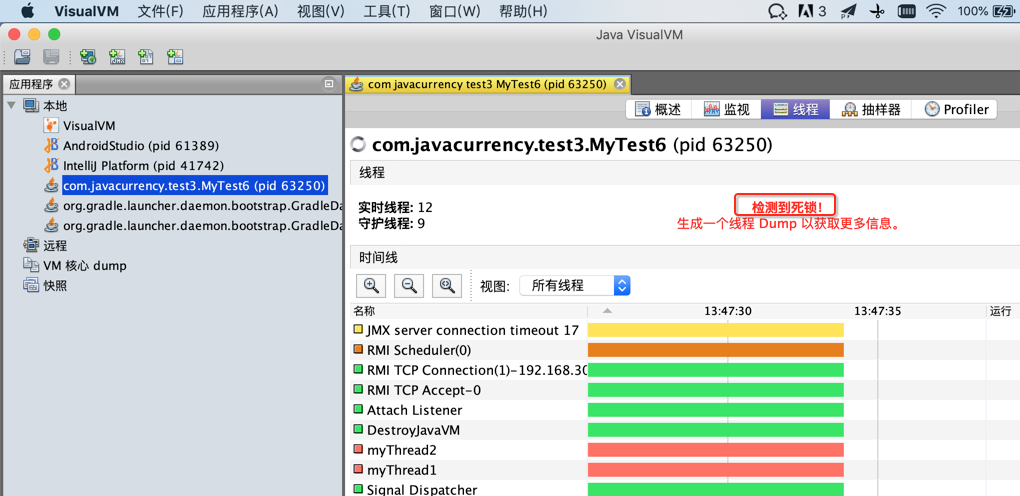
此时我们可以点击“线程dump”来进行详细死锁的跟踪:


其中看到的"BLOCKED"状态其实是在Thread类中的枚举值所定义的,如下:
public enum State {
        /**
         * Thread state for a thread which has not yet started.
         */
        NEW,

        /**
         * Thread state for a runnable thread.  A thread in the runnable
         * state is executing in the Java virtual machine but it may
         * be waiting for other resources from the operating system
         * such as processor.
         */
        RUNNABLE,

        /**
         * Thread state for a thread blocked waiting for a monitor lock.
         * A thread in the blocked state is waiting for a monitor lock
         * to enter a synchronized block/method or
         * reenter a synchronized block/method after calling
         * {@link Object#wait() Object.wait}.
         */
        BLOCKED,

        /**
         * Thread state for a waiting thread.
         * A thread is in the waiting state due to calling one of the
         * following methods:
         * <ul>
         *   <li>{@link Object#wait() Object.wait} with no timeout</li>
         *   <li>{@link #join() Thread.join} with no timeout</li>
         *   <li>{@link LockSupport#park() LockSupport.park}</li>
         * </ul>
         *
         * <p>A thread in the waiting state is waiting for another thread to
         * perform a particular action.
         *
         * For example, a thread that has called <tt>Object.wait()</tt>
         * on an object is waiting for another thread to call
         * <tt>Object.notify()</tt> or <tt>Object.notifyAll()</tt> on
         * that object. A thread that has called <tt>Thread.join()</tt>
         * is waiting for a specified thread to terminate.
         */
        WAITING,

        /**
         * Thread state for a waiting thread with a specified waiting time.
         * A thread is in the timed waiting state due to calling one of
         * the following methods with a specified positive waiting time:
         * <ul>
         *   <li>{@link #sleep Thread.sleep}</li>
         *   <li>{@link Object#wait(long) Object.wait} with timeout</li>
         *   <li>{@link #join(long) Thread.join} with timeout</li>
         *   <li>{@link LockSupport#parkNanos LockSupport.parkNanos}</li>
         *   <li>{@link LockSupport#parkUntil LockSupport.parkUntil}</li>
         * </ul>
         */
        TIMED_WAITING,

        /**
         * Thread state for a terminated thread.
         * The thread has completed execution.
         */
        TERMINATED;
    }
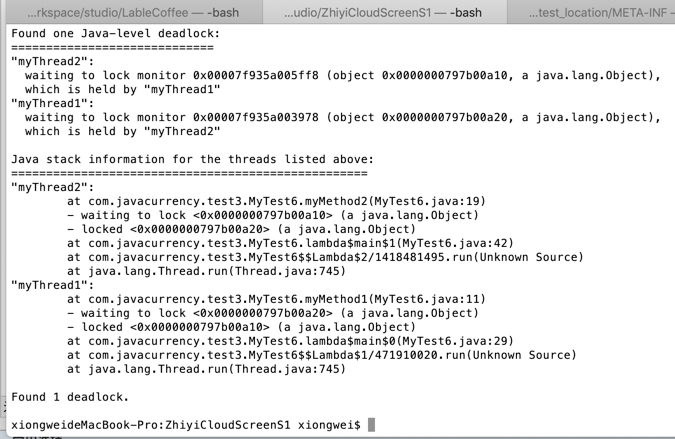
另外,在dump信息最后还有一个对死锁的总述:

这是用的可视化的工具来查看死锁的工具,但有时可能操作系统不支持查看可视化的工具,比如一些服务器只支持命令的方式来查看,此时就可以换另外一个JDK自带的工具来查看,如下:
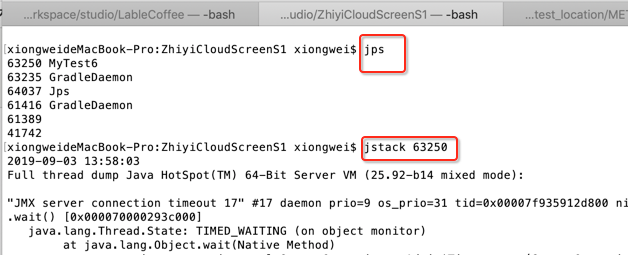
其中的输出信息跟在jvisualvm所看到的是一样的,只是是在命令行中来查看的:
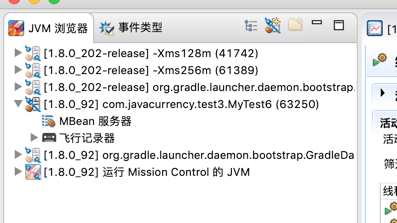
另外还可以用强大的JMS工具来查看: