python信用评分卡建模(附代码,博主录制)
1.自变量进行筛选
IV的全称是Information Value,中文意思是信息价值,或者信息量。
我们在用逻辑回归、决策树等模型方法构建分类模型时,经常需要对自变量进行筛选。比如我们有200个候选自变量,通常情况下,不会直接把200个变量直接放到模型中去进行拟合训练,而是会用一些方法,从这200个自变量中挑选一些出来,放进模型,形成入模变量列表。那么我们怎么去挑选入模变量呢?
挑选入模变量过程是个比较复杂的过程,需要考虑的因素很多,比如:变量的预测能力,变量之间的相关性,变量的简单性(容易生成和使用),变量的强壮性(不容易被绕过),变量在业务上的可解释性(被挑战时可以解释的通)等等。但是,其中最主要和最直接的衡量标准是变量的预测能力。
“变量的预测能力”这个说法很笼统,很主观,非量化,在筛选变量的时候我们总不能说:“我觉得这个变量预测能力很强,所以他要进入模型”吧?我们需要一些具体的量化指标来衡量每自变量的预测能力,并根据这些量化指标的大小,来确定哪些变量进入模型。IV就是这样一种指标,他可以用来衡量自变量的预测能力。类似的指标还有信息增益、基尼系数等等。
补充说明对数简写

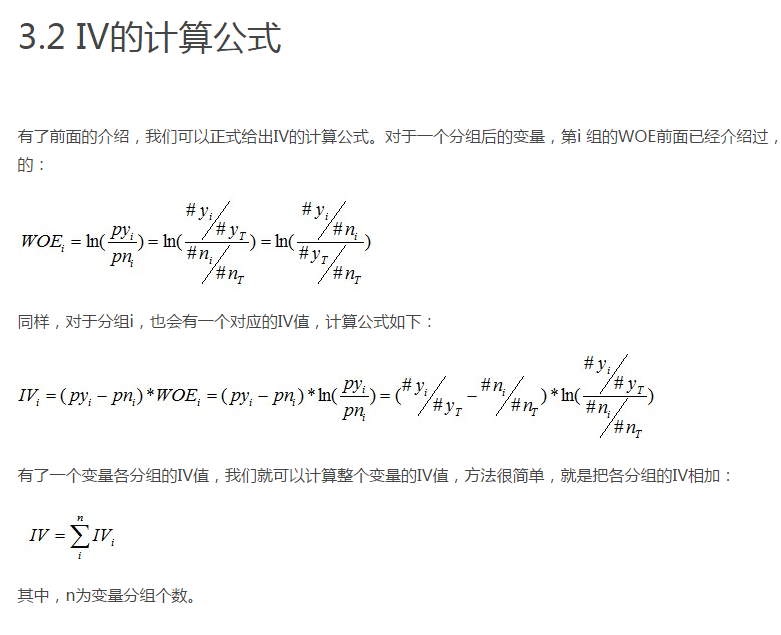

np.log(a) np.log10(a) np.log2(a) : 计算各元素的自然对数、10、2为底的对数
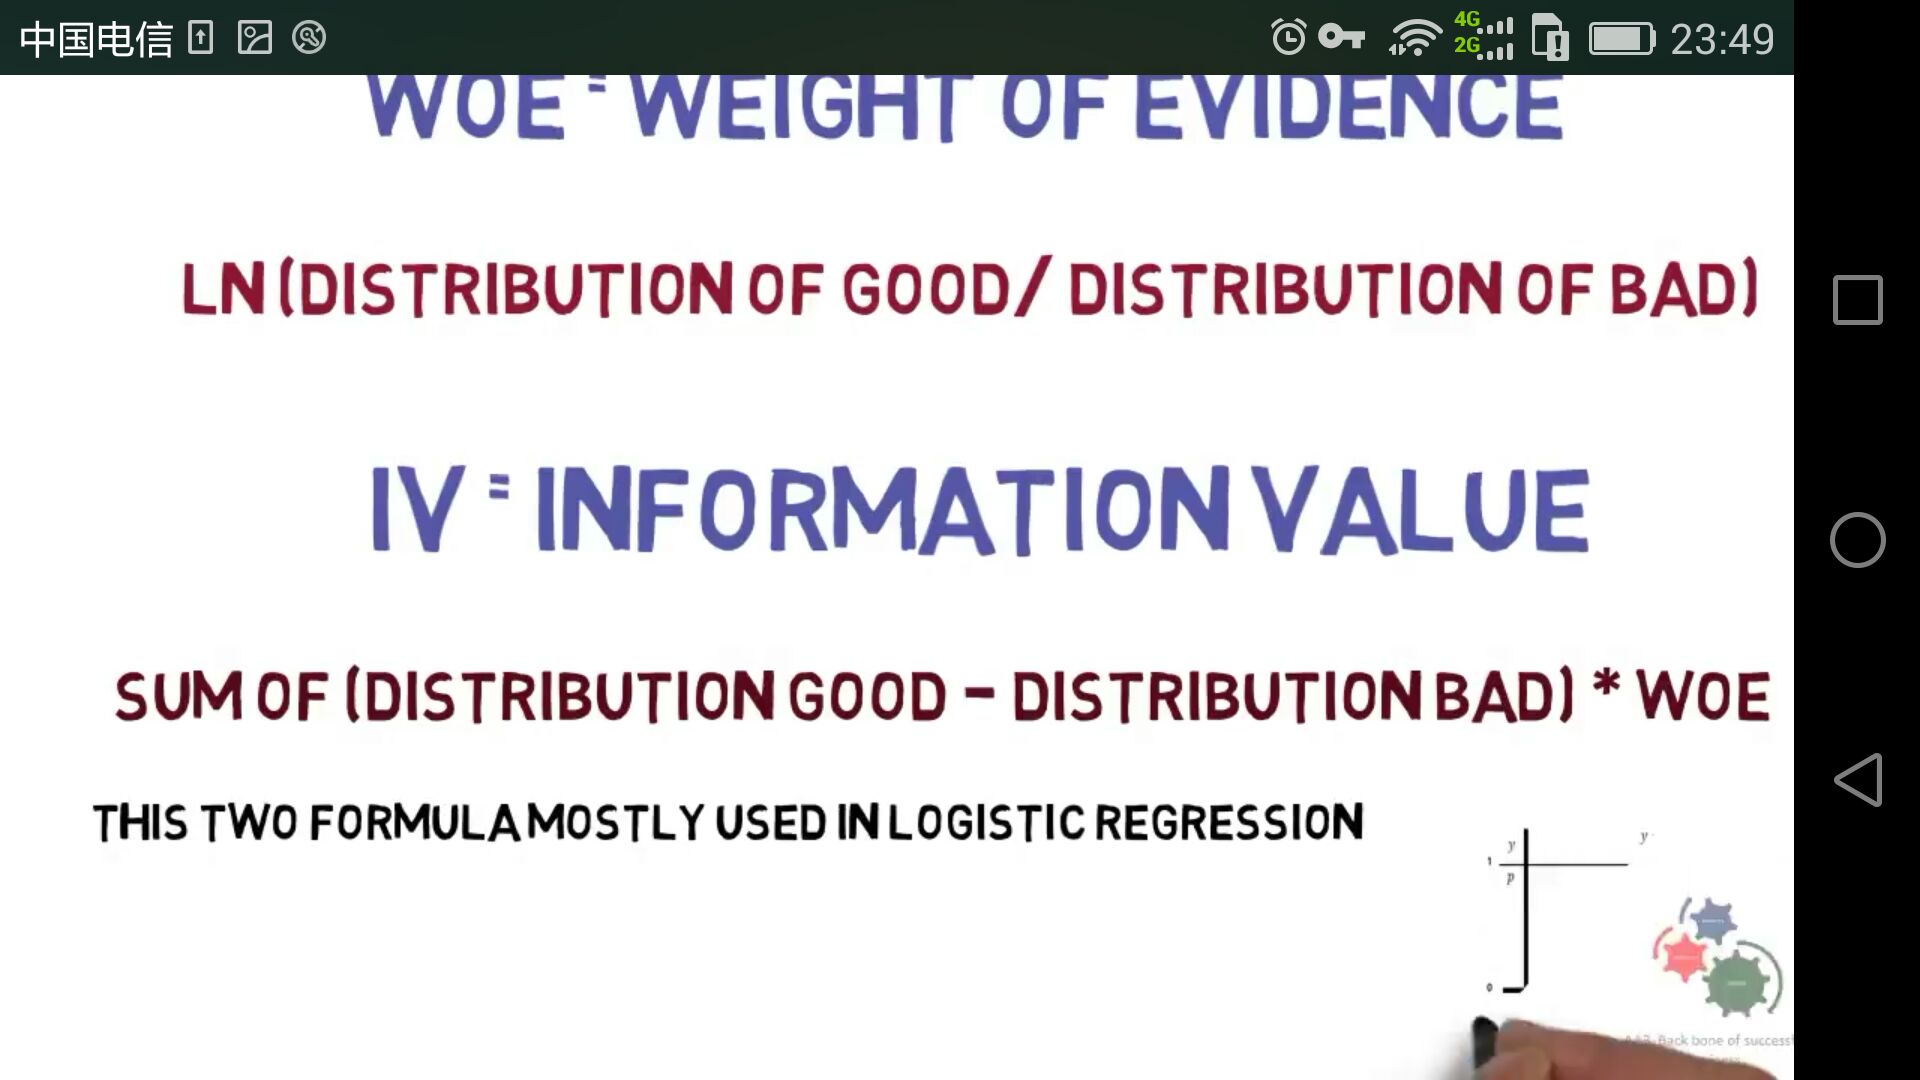
WOE(Weight of Evidence)
WOE的全称是“Weight of Evidence”,即证据权重。
因子数量/好客户总数,必须进行加权处理

文件夹内数据

# -*- coding: utf-8 -*-
"""
Created on Thu Jan 11 10:09:47 2018

@author: Administrator
好客户数据是第一列
坏客户数据是第二列
"""
import pandas as pd
import numpy as np
import matplotlib.pyplot as plt

#读取文件
readFileName="frequency_compare.xlsx"
#保存文件
saveFileName="woe_iv.xlsx"

#读取excel
df=pd.read_excel(readFileName)
#如果有多个sheet表格,要用sheet_name参数

#第一列字段名(好客户属性)
column1Name_good=list(df.columns)[0]
#第二列字段名(坏客户属性)
column2Name_bad=list(df.columns)[1]

#第一列好客户内容和第二列坏客户内容
column_goodCustomers=df[column1Name_good]
column_badCustomers=df[column2Name_bad]

#去掉NAN
num_goodCustomers=column_goodCustomers.dropna()
#统计数量
num_goodCustomers=num_goodCustomers.size

#去掉NAN
num_badCustomers=column_badCustomers.dropna()
#统计数量
num_badCustomers=num_badCustomers.size


#第一列频率分析
fenquency_goodCustomers=column_goodCustomers.value_counts()
#第二列频率分析
fenquency_badCustomers=column_badCustomers.value_counts()


#各个元素占比
ratio_goodCustomers=fenquency_goodCustomers/num_goodCustomers

ratio_badCustomers=fenquency_badCustomers/num_badCustomers

#最终好坏比例
ratio_goodDevideBad=ratio_goodCustomers/ratio_badCustomers

#woe函数,阵列计算
def Woe(ratio_goodDevideBad):
    woe=np.log(ratio_goodDevideBad)
    return woe

#iv函数,阵列计算
def Iv(woe):
    iv=(ratio_goodCustomers-ratio_badCustomers)*woe
    return iv

#iv参数评估,参数iv_sum(变量iv总值)
def Iv_estimate(iv_sum):
    #评估能力较强
    if 0.5>iv_sum>0.3:
        print("good informative")
        return "A"
    #评估能力一般
    if 0.3>iv_sum>0.1:
        print("medium informative")
        return "B"
    #评估能力强或可疑
    if iv_sum>0.5:
        print("good informative or suspicious")
        return "C"

#详细参数输出
def Print():
    print("iv_sum",iv_sum)
    #print("",)
    #print("",)


woe=Woe(ratio_goodDevideBad)
iv=Iv(woe)

df_write=pd.DataFrame({"woe":woe,"iv":iv})

#ratio_badDevideGood数据写入到result_compare_badDevideGood.xlsx文件
df_write.to_excel(saveFileName, sheet_name='Sheet1')


#计算iv总和,评估整体变量
iv_sum=sum([i for i in iv if np.isnan(i)!=True])
#iv参数评估,参数iv_sum(变量iv总值)
iv_estimate=Iv_estimate(iv_sum)

Print()
结果:
预测有价值变量准确,但不完整,因为没有进行分箱,造成损失

举例说明
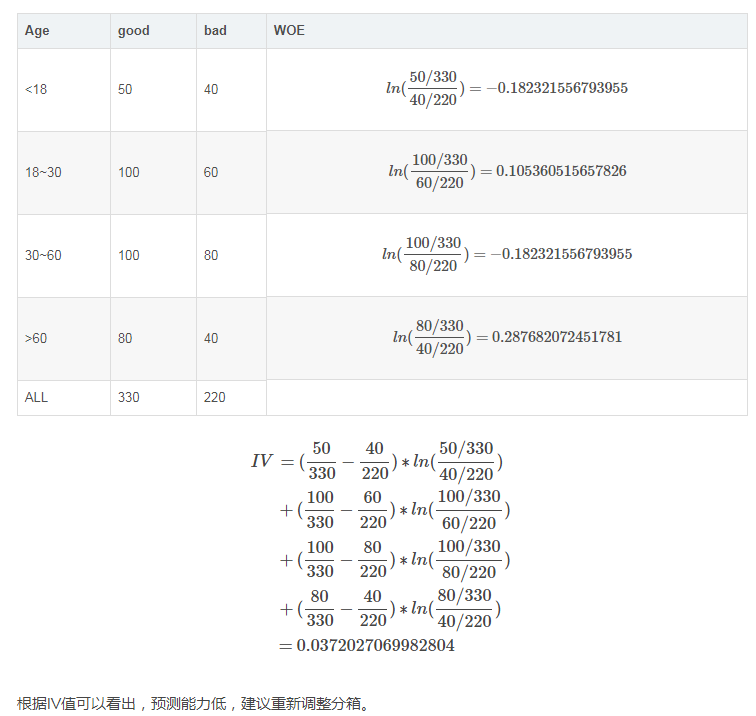
例如按年龄分组,一般进行分箱,我们都喜欢按照少年、青年、中年、老年几大类进行分组,但效果真的不一定好:
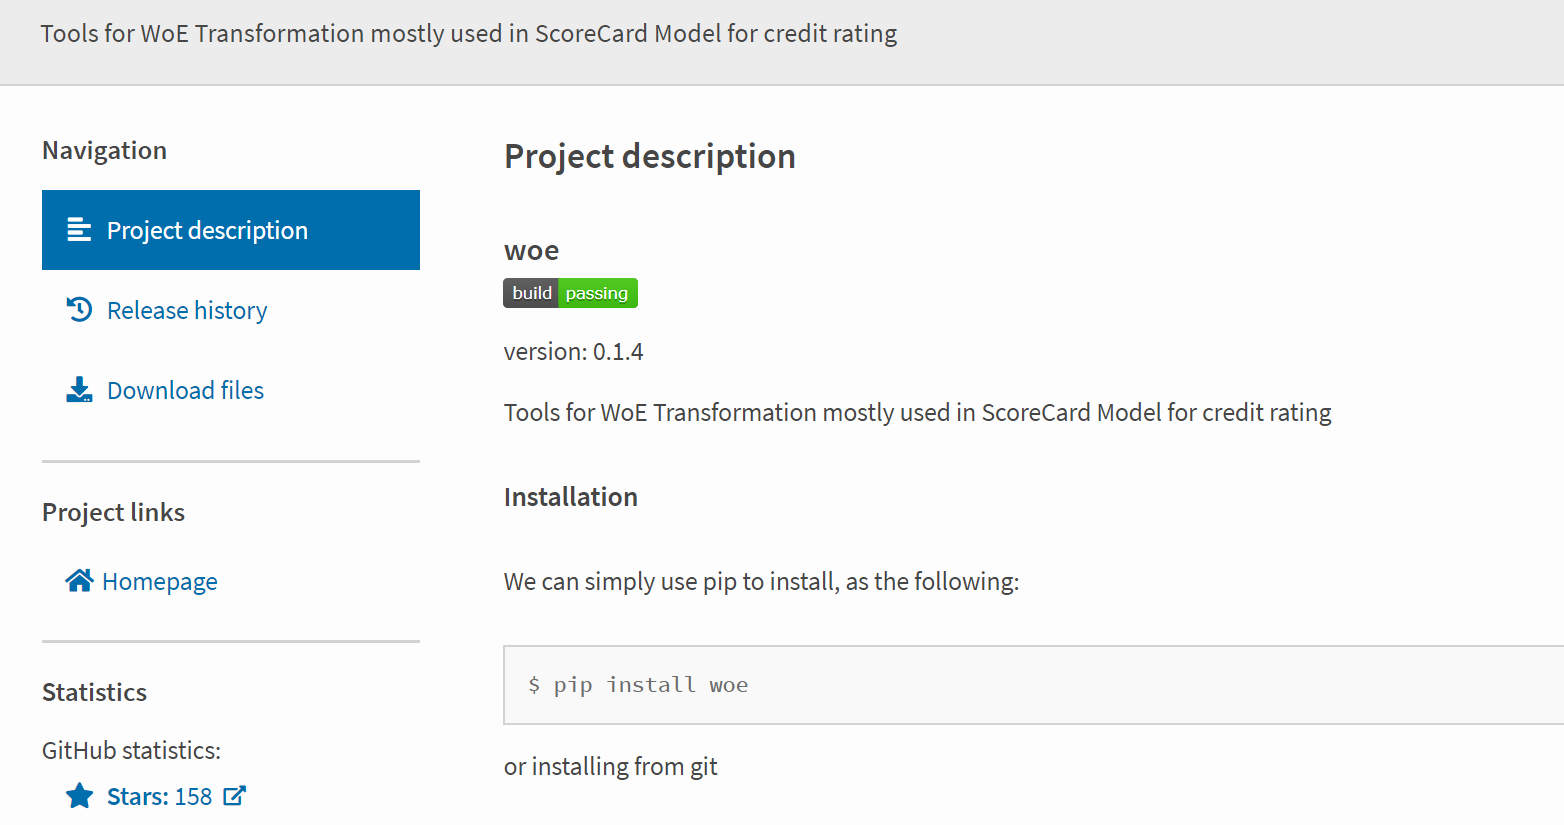
woe的第三方包(pip install woe; pip install reportgen)
实例:
https://blog.csdn.net/KIDxu/article/details/88647080
官方给的例子不是很好理解,以下是我写的一个使用示例。以此例来说明各主要函数的使用方法。计算woe的各相关函数主要在feature_process.py中定义。
import woe.feature_process as fp
import woe.eval as eval

#%% woe分箱, iv and transform
data_woe = data #用于存储所有数据的woe值
civ_list = []
n_positive = sum(data['target'])
n_negtive = len(data) - n_positive
for column in list(data.columns[1:]):
    if data[column].dtypes == 'object':
        civ = fp.proc_woe_discrete(data, column, n_positive, n_negtive, 0.05*len(data), alpha=0.05)
    else:
        civ = fp.proc_woe_continuous(data, column, n_positive, n_negtive, 0.05*len(data), alpha=0.05)
    civ_list.append(civ)
    data_woe[column] = fp.woe_trans(data[column], civ)

civ_df = eval.eval_feature_detail(civ_list,'output_feature_detail_0315.csv')
#删除iv值过小的变量
iv_thre = 0.001
iv = civ_df[['var_name','iv']].drop_duplicates()
x_columns = iv.var_name[iv.iv > iv_thre]
计算分箱,woe,iv
核心函数主要是freature_process.proc_woe_discrete()与freature_process.proc_woe_continuous(),分别用于计算连续变量与离散变量的woe。它们的输入形式相同:
proc_woe_discrete(df,var,global_bt,global_gt,min_sample,alpha=0.01)
proc_woe_continuous(df,var,global_bt,global_gt,min_sample,alpha=0.01)
输入:
df: DataFrame,要计算woe的数据,必须包含'target'变量,且变量取值为{0,1}
var:要计算woe的变量名
global_bt:全局变量bad total。df的正样本数量
global_gt:全局变量good total。df的负样本数量
min_sample:指定每个bin中最小样本量,一般设为样本总量的5%。
alpha:用于自动计算分箱时的一个标准,默认0.01.如果iv_划分>iv_不划分*(1+alpha)则划分。
输出:一个自定义的InfoValue类的object,包含了分箱的一切结果信息。
该类定义见以下一段代码。
class InfoValue(object):
    '''
    InfoValue Class
    '''
    def __init__(self):
        self.var_name = []
        self.split_list = []
        self.iv = 0
        self.woe_list = []
        self.iv_list = []
        self.is_discrete = 0
        self.sub_total_sample_num = []
        self.positive_sample_num = []
        self.negative_sample_num = []
        self.sub_total_num_percentage = []
        self.positive_rate_in_sub_total = []
        self.negative_rate_in_sub_total = []

    def init(self,civ):
        self.var_name = civ.var_name
        self.split_list = civ.split_list
        self.iv = civ.iv
        self.woe_list = civ.woe_list
        self.iv_list = civ.iv_list
        self.is_discrete = civ.is_discrete
        self.sub_total_sample_num = civ.sub_total_sample_num
        self.positive_sample_num = civ.positive_sample_num
        self.negative_sample_num = civ.negative_sample_num
        self.sub_total_num_percentage = civ.sub_total_num_percentage
        self.positive_rate_in_sub_total = civ.positive_rate_in_sub_total
        self.negative_rate_in_sub_total = civ.negative_rate_in_sub_total
打印分箱结果
eval.eval_feature_detail(Info_Value_list,out_path=False)
输入:
Info_Value_list:存储各变量分箱结果(proc_woe_continuous/discrete的返回值)的List.
out_path:指定的分箱结果存储路径,输出为csv文件
输出:
各变量分箱结果的DataFrame。各列分别包含如下信息:
var_name 变量名
split_list 划分区间
sub_total_sample_num 该区间总样本数
positive_sample_num 该区间正样本数
negative_sample_num 该区间负样本数
sub_total_num_percentage 该区间总占比
positive_rate_in_sub_total 该区间正样本占总正样本比例
woe_list woe
iv_list 该区间iv
iv
该变量iv(各区间iv之和)
输出结果一个示例(截取部分):
woe转换
得到分箱及woe,iv结果后,对原数据进行woe转换,主要用以下函数
woe_trans(dvar,civ): replace the var value with the given woe value
输入:
dvar: 要转换的变量,Series
civ: proc_woe_discrete或proc_woe_discrete输出的分箱woe结果,自定义的InfoValue类
输出:
var: woe转换后的变量,Series
分箱原理
该包中对变量进行分箱的原理类似于二叉决策树,只是决定如何划分的目标函数是iv值。
1)连续变量分箱
首先简要描述分箱主要思想:
-------------------------------------------------------
1.初始化数据集D =D0为全量数据。转步骤2
2.对于D,将数据按从小到大排序并按数量等分为10份,记录各划分点。计算不进行仍何划分时的iv0,转步骤3.
3.遍历各划分点,计算利用各点进行二分时的iv。
如果最大iv>iv0*(1+alpha)(用户给定,默认0.01): 则进行划分,且最大iv对应的即确定为此次划分点。它将D划分为左右两个结点,数据集分别为DL, DR.转步骤4.
否则:停止。
4.分别令D=DL,D=DR,重复步骤2.
-------------------------------------------------------
为了便于理解,上面简化了一些条件。实际划分时还设计到一些限制条件,如不满足会进行区间合并。
主要限制条件有以下2个:
a.每个bin的数量占比>min_sample(用户给定)
b.每个bin的target取值个数>1,即每个bin必须同时包含正负样本。
2)连续变量分箱
对于离散变量分箱后续补充 to be continued...
--------------------------
python风控建模实战lendingClub(博主录制,catboost,lightgbm建模,2K超清分辨率)
https://study.163.com/course/courseMain.htm?courseId=1005988013&share=2&shareId=400000000398149
扫描和关注博主二维码,学习免费python视频教学资源

