python机器学习-乳腺癌细胞挖掘(博主亲自录制视频)
https://study.163.com/course/introduction.htm?courseId=1005269003&utm_campaign=commission&utm_source=cp-400000000398149&utm_medium=share

This is a simple one: an even probability for all data values (Fig. 6.21). Not very
common for real data.

应用
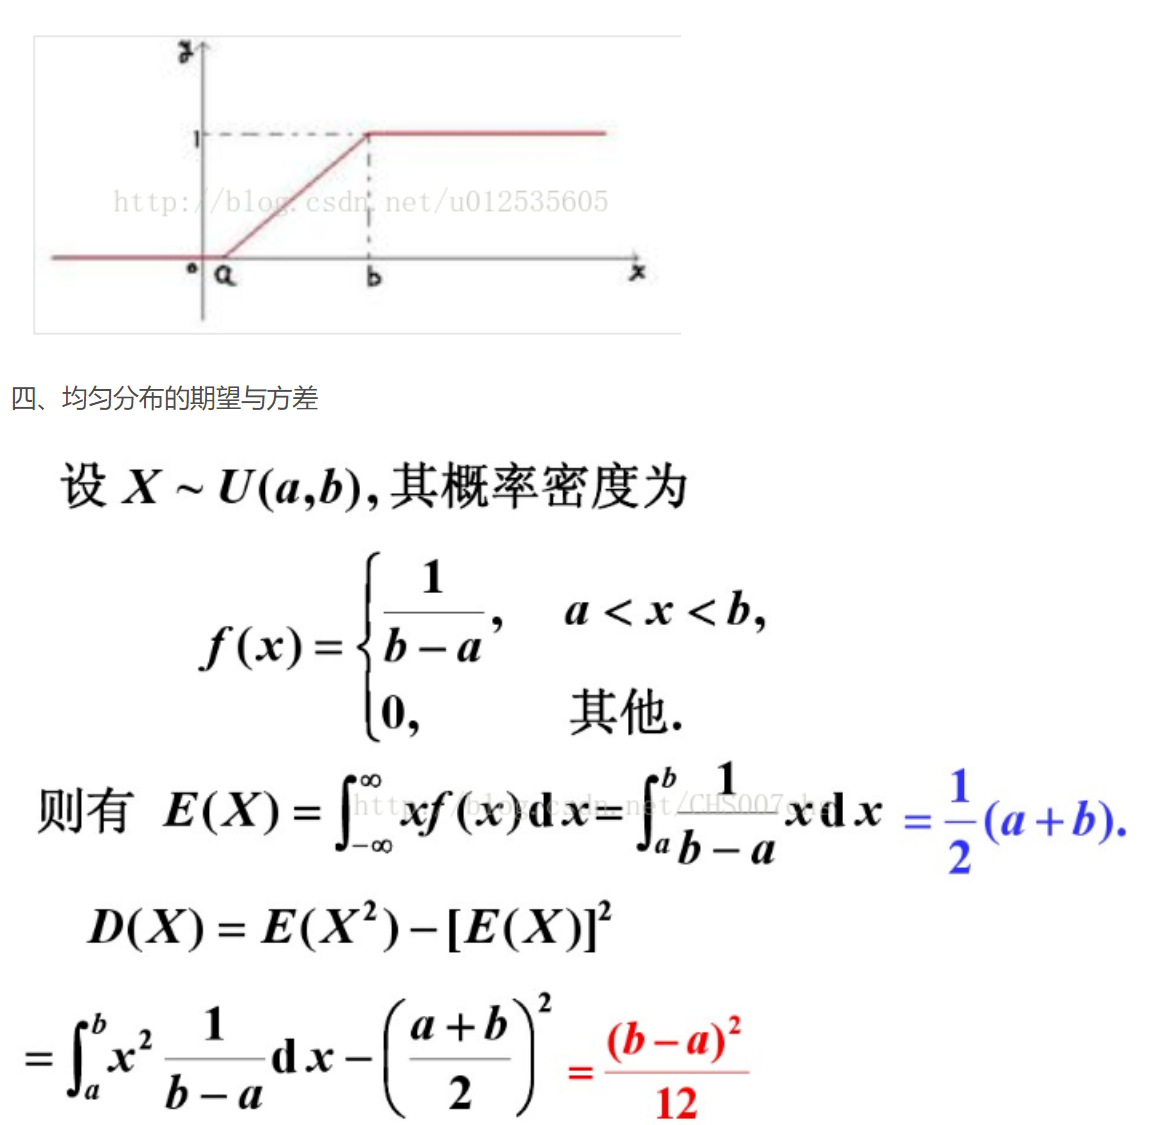
一、概率密度函数和分布函数
分布函数是概率密度函数从负无穷到正无穷上的积分;
在坐标轴上,概率密度函数的函数值y表示落在x点上的概率为y;
分布函数的函数值y则表示x落在区间(-∞,+∞)上的概率。
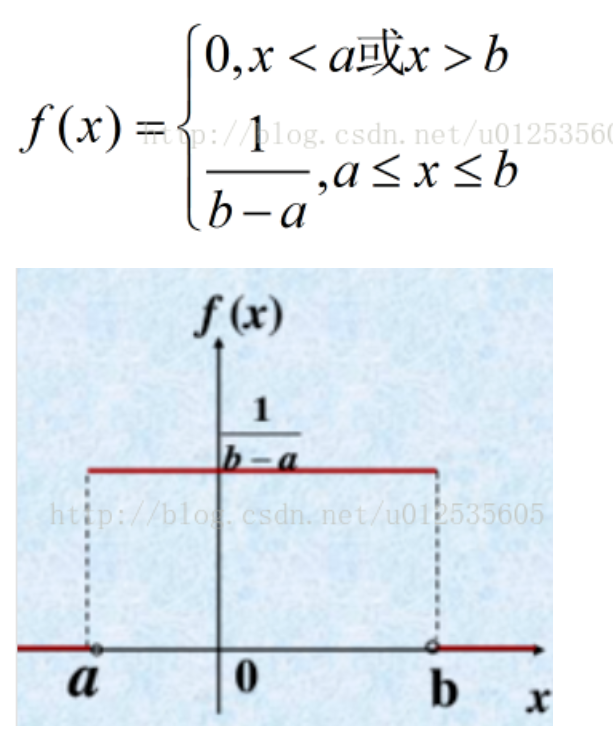
二、均匀分布的概率密度函数
假设x服从[a,b]上的均匀分布,则x的概率密度函数如下
————————————————

Understanding Uniform Distribution
There are two types of uniform distributions: discrete and continuous. The possible results of rolling a die provide an example of a discrete uniform distribution: it is possible to roll a 1, 2, 3, 4, 5 or 6, but it is not possible to roll a 2.3, 4.7 or 5.5. Therefore, the roll of a die generates a discrete distribution with p = 1/6 for each outcome.
Some uniform distributions are continuous rather than discrete. An idealized random number generator would be considered a continuous uniform distribution. With this type of distribution, every variable has an equal opportunity of appearing, yet there are a continuous (or possibly infinite) number of points that can exist.
There are several other important continuous distributions, such as the normal distribution, chi-square, and Student's t-distribution. A uniform distribution with only two possible outcomes is a special case of the binomial distribution.
There are also several data generating or data analyzing functions associated with distributions to help understand the variables and their variance within a data set. These functions include probability density function, cumulative density and moment generating functions.
KEY TAKEAWAYS
- Uniform distributions are probability distributions with equally likely outcomes.
- There are two types of uniform distributions: discrete and continuous. In the former type of distribution, each outcome is discrete. In a continuous distribution, outcomes are continuous and infinite.
Visualizing Uniform Distributions
A distribution is a simple way to visualize a set of data, either as a graph or in a list of stating which random variables have lower or higher chances of happening. There are many different types of probability distributions, and the uniform distribution is perhaps the simplest of them all.
Under a uniform distribution, the set of variables all have the exact same possibility of happening. This distribution, when displayed as a bar or line graph, has the same height for each potential outcome. In this way, it can look like a rectangle and therefore is sometimes described as the rectangle distribution. If you think about the possibility of drawing a particular suit from a deck of playing cards, there is a random yet equal chance of pulling a hearts as there is for pulling a spade - that is, 1/4.
https://study.163.com/provider/400000000398149/index.htm?share=2&shareId=400000000398149( 欢迎关注博主主页,学习python视频资源,还有大量免费python经典文章)
