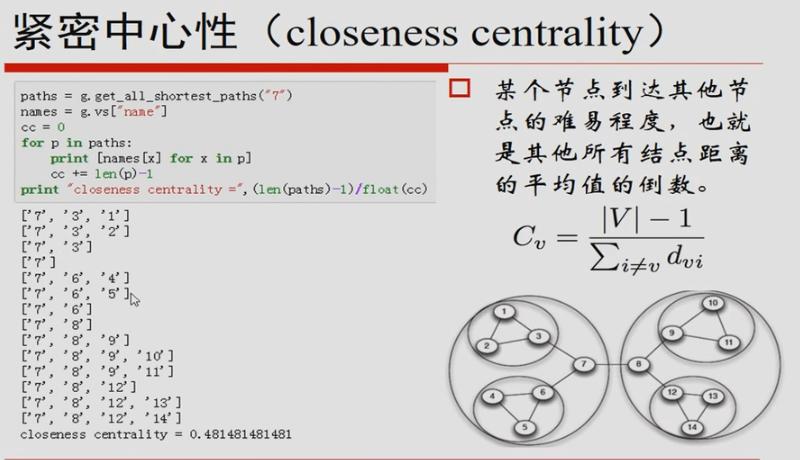
# coding: utf-8
import csv
from igraph import Graph as IGraph
#1.
path="net.data"
edges=[]#边长集合
with open(path,"r") as file:
    for row in csv.reader(file.read().splitlines()):
        print(row)#打印数据
        u,v=[i for i in row]
        edges.append((u,v))
print("------------------------------------------")
g=IGraph.TupleList(edges,
                   directed=False,#是否有向
                   vertex_name_attr="name",#点的名字
                   edge_attrs=None,#边长属性
                   weights=False)#权重-路径

for pdegree in g.vs:#统计
    print(pdegree["name"],pdegree.degree())#打印节点,左边名称右边度数
print("------------------------------------------")
print(str(g).splitlines())#打印信息
print("------------------------------------------")
#2.紧密中心度计算
paths=g.get_all_shortest_paths("7")#找到包含7的路径
cc=0
names=g.vs["name"]#代表顶点名称
for path in paths:#筛选所有包含7的
    print([names[x] for x  in path])
    cc+= (len(path)-1)#减一是减去自己到其他边
print(  "result:",float(len(paths)-1) / cc )
#紧密中心程度=(包含该顶点的所有边数-1)/(包含该顶点的所有路径)
#-1是因为减去自己
#3.封装调用
ccvs=[]
#zip(g.vs,g.closeness()) 数据打包list,包含每个节点名称和紧密程度
for path in zip(g.vs,g.closeness()):
    ccvs.append({"name":path[0]["name"],"cc":path[1]})
for c in ccvs:
    print(c)

v = sorted(ccvs,key= lambda x:x["cc"],reverse=True)#排序
print(v)

示例:
['7', '3', '1'] 2
['7', '3', '2'] 2
['7', '3'] 1
['7'] 0
['7', '6', '4'] 2
['7', '6', '5'] 2
['7', '6'] 1
['7', '8'] 1
['7', '8', '9'] 2
['7', '8', '9', '10'] 3
['7', '8', '9', '11'] 3
['7', '8', '12'] 2
['7', '8', '12', '13'] 3
['7', '8', '12', '14'] 3
紧密中心度=(2+2+1+0+2+2+1+1+2+3+3+2+3+3)/ (14-1)=0.48148148148148145