• echarts tree 点击动态添加子集实例


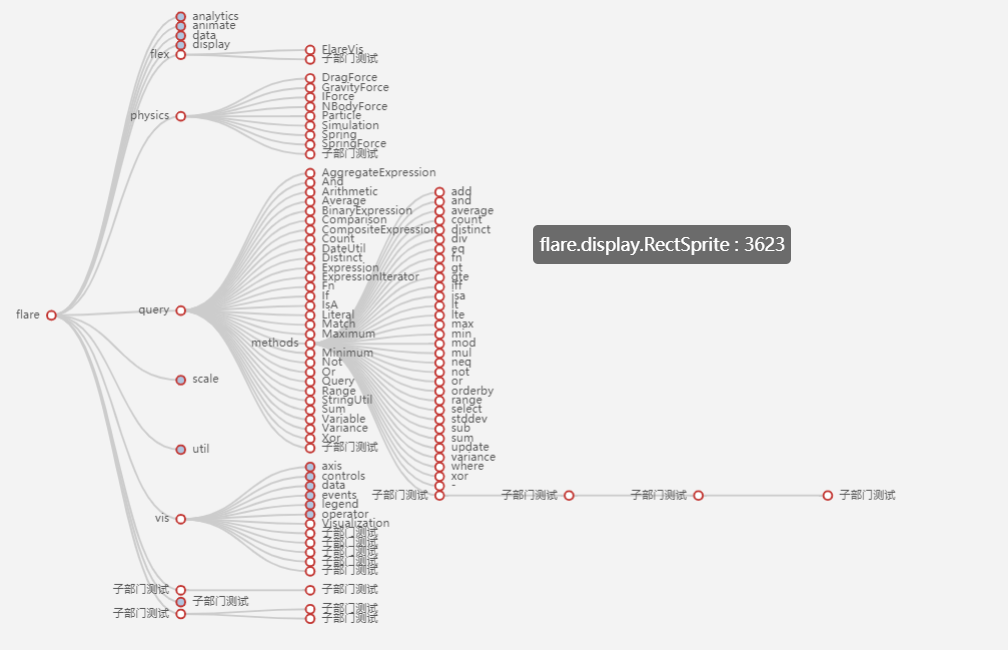
    下边是echarts官网的例子 我只是在底部加了一个点击事件以及点击的时候动态添加子集
    效果图:


    1
    myChart.showLoading(); 2 $.get(ROOT_PATH + 'data/asset/data/flare.json', function (data) { 3 myChart.hideLoading(); 4 5 echarts.util.each(data.children, function (datum, index) { 6 index % 2 === 0 && (datum.collapsed = true); 7 }); //上面这部分用的时候可以去掉,至于json数据可以用自己的,格式{name:",children:[{name:'',children[]}]},根据自己实际情况添加数据,也可在里面添加value用于判断用,
    用这个实例之前必须先获取dom节点,绑定id之后设置一个变量例如:

            这里的myChart可以用this.echartTreeBj代替

      9     myChart.setOption(option = {
     10         tooltip: {
     11             trigger: 'item',
     12             triggerOn: 'mousemove'
     13         },
     14         series: [
     15             {
     16                 type: 'tree',
     17 
     18                 data: [data],
     19 
     20                 top: '1%',
     21                 left: '7%',
     22                 bottom: '1%',
     23                 right: '20%',
     24 
     25                 symbolSize: 7,
     26 
     27                 label: {
     28                     normal: {
     29                         position: 'left',
     30                         verticalAlign: 'middle',
     31                         align: 'right',
     32                         fontSize: 9
     33                     }
     34                 },
     35 
     36                 leaves: {
     37                     label: {
     38                         normal: {
     39                             position: 'right',
     40                             verticalAlign: 'middle',
     41                             align: 'left'
     42                         }
     43                     }
     44                 },
     45 
     46                 expandAndCollapse: true,
     47                 animationDuration: 550,
     48                 animationDurationUpdate: 750
     49             }
     50         ]
     51     });
     52 });
     53 myChart.on("click", function(param){
     54     console.log(param)
     55      if (typeof param.seriesIndex == 'undefined') {
     56                     return;
     57             }
     58         if (param.type == 'click') {
     59              if (!param.data.hasChild) {
     60                  //param.data.collapsed=true;
     61                  console.log(param.data.collapsed);
     62                  if(param.data.collapsed == undefined || param.data.collapsed == true){
     63                      console.log("未定义或者是未展开,下次即将展开");
     64                      param.data.collapsed=false;
     65                  }else{
     66                     console.log("下次不展开");
     67                      param.data.collapsed=true;
     68                      return;
     69                  }
     70                  
     71              }
     72             param.data.children.push({name:"子部门测试",children:[]});//这里可以修改你动态获取到的数据在此赋值到data里面
     73             param.data.hasChild =false; 
     74             param.data.collapsed=false;
     75             
     76             console.log(param.data);
     77             console.log(myChart.getOption().series[0].data);
     78             data = myChart.getOption().series[0].data;
     79             myChart.clear();
     80             myChart.setOption(option = {
     81                 tooltip: {
     82                     trigger: 'item',
     83                     triggerOn: 'mousemove'
     84                 },
     85                 series: [
     86                     {
     87                         type: 'tree',
     88             
     89                         data: data,
     90                         initialTreeDepth: 1,
     91                         top: '1%',
     92                         left: '7%',
     93                         bottom: '1%',
     94                         right: '20%',
     95             
     96                         symbolSize: 7,
     97             
     98                         label: {
     99                             normal: {
    100                                 position: 'left',
    101                                 verticalAlign: 'middle',
    102                                 align: 'right',
    103                                 fontSize: 9
    104                             }
    105                         },
    106             
    107                         leaves: {
    108                             label: {
    109                                 normal: {
    110                                     position: 'right',
    111                                     verticalAlign: 'middle',
    112                                     align: 'left'
    113                                 }
    114                             }
    115                         },
    116             
    117                         expandAndCollapse: true,
    118                         animationDuration: 100,
    119                         animationDurationUpdate: 0
    120                     }
    121                 ]
    122             });
    123         }
    124 })
  • 相关阅读:
    基本数据结构:链表(list)
    字符串函数
    TCHAR
    开源库链接
    视频 链接
    tabbar
    加密
    安全类链接,https
    资本
    审核 -链接 - 发布证书
  • 原文地址:https://www.cnblogs.com/wasbg/p/11475515.html
Copyright © 2020-2023  润新知