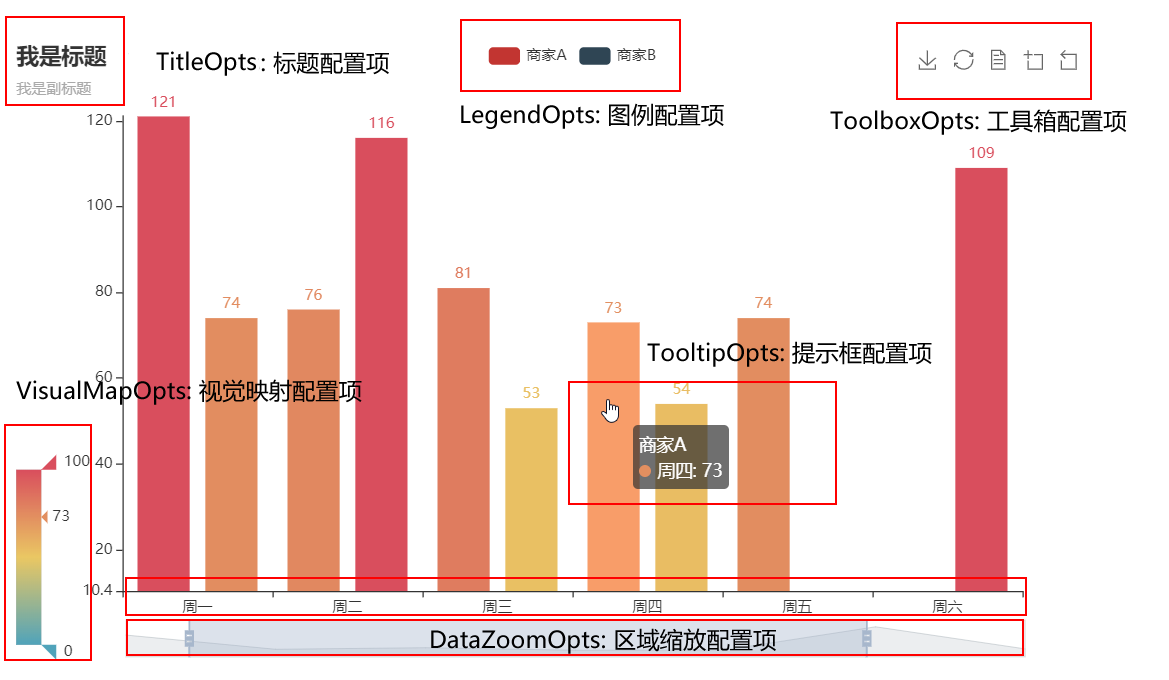
可视化可以直接利用:
init_opts=opts.InitOpts(width="800px",height="600px",
#                                 animation_opts=opts.AnimationOpts(animation_delay=1000, animation_easing="elasticOut")
.set_series_opts(label_opts=opts.LabelOpts(is_show=False))
    .set_global_opts(title_opts=opts.TitleOpts(title="Geo-Lines-background",subtitle="我是副标题",pos_left="center",pos_top="0px"),
                     legend_opts=opts.LegendOpts(pos_top="35px"),
                     tooltip_opts=opts.TooltipOpts(formatter="{a}:{b}")
#                      dataZoomOpts=opts.DataZoomOpts(is_show=True)
                     )
from pyecharts import options as opts
from pyecharts.charts import Geo
from pyecharts.globals import ChartType, SymbolType

c = (
    Geo(init_opts=opts.InitOpts(width="800px",height="600px",
#                                 animation_opts=opts.AnimationOpts(animation_delay=1000, animation_easing="elasticOut")
                               )
       )
    .add_schema(
        maptype="china",
        itemstyle_opts=opts.ItemStyleOpts(color="#323c48", border_color="#111"),
    )
    .add(
        "",
        [("广州", 55), ("北京", 66), ("杭州", 77), ("重庆", 88)],
        type_=ChartType.EFFECT_SCATTER,
        color="white",
    )
    .add(
        "geo",
        b,
        type_=ChartType.LINES,
        effect_opts=opts.EffectOpts(
            symbol=SymbolType.ARROW, symbol_size=6, color="blue"
        ),
        linestyle_opts=opts.LineStyleOpts(curve=0.2),
    )
    .set_series_opts(label_opts=opts.LabelOpts(is_show=False))
    .set_global_opts(title_opts=opts.TitleOpts(title="Geo-Lines-background",subtitle="我是副标题",pos_left="center",pos_top="0px"),
                     legend_opts=opts.LegendOpts(pos_top="35px"),
                     tooltip_opts=opts.TooltipOpts(formatter="{a}:{b}")
#                      dataZoomOpts=opts.DataZoomOpts(is_show=True)
                     )

)
c.render_notebook()
a=["广州","上海","北京","杭州","乌鲁木齐"]
for i in range(len(a)):
    for j in range(i+1,len(a)):
        b.append((a[i],a[j]))