| StackedBar | StackedColumn | StackedArea |
 |
 |
 |
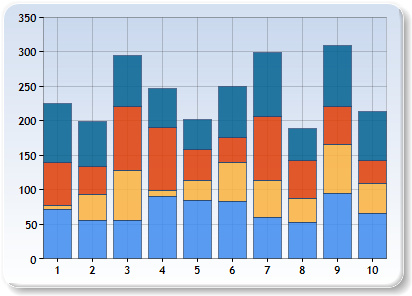
<asp:CHART id="Chart1" runat="server" Height="296px" Width="412px" BackColor="#D3DFF0" Palette="BrightPastel"
 BorderlineDashStyle="Solid" BackGradientStyle="TopBottom" BorderWidth="2" BorderColor="26, 59, 105">
                   <legends>
                  <asp:Legend TitleFont="Microsoft Sans Serif, 8pt, style=Bold" BackColor="Transparent" Font="Trebuchet M                                S, 8.25pt, style=Bold" IsTextAutoFit="False" Enabled="False" Name="Default"></asp:Legend>
                            </legends>
                            <borderskin SkinStyle="Emboss"></borderskin>
                            <series>
                                <asp:Series Name="Series1" ChartType="StackedArea100" BorderColor="180, 26, 59, 105" Color="220, 65, 14                                0, 240"></asp:Series>
                                <asp:Series Name="Series2" ChartType="StackedArea100" BorderColor="180, 26, 59, 105" Color="220, 252, 1                                80, 65"></asp:Series>
                                <asp:Series Name="Series3" ChartType="StackedArea100" BorderColor="180, 26, 59, 105" Color="220, 224, 6                                4, 10"></asp:Series>
                                <asp:Series Name="Series4" ChartType="StackedArea100" BorderColor="180, 26, 59, 105" Color="220, 5, 100                                , 146"></asp:Series>
                            </series>
                            <chartareas>
                                <asp:ChartArea Name="ChartArea1" BorderColor="64, 64, 64, 64" BorderDashStyle="Solid" BackSecondaryColor="Transparent" BackColor="64, 165, 191, 228" ShadowColor="Transparent" BackGradientStyle="TopBottom">
                                    <area3dstyle Rotation="10" Inclination="15" WallWidth="0" />
                                    <position Y="3" Height="92" Width="92" X="2"></position>
                                    <axisy LineColor="64, 64, 64, 64"  LabelAutoFitMaxFontSize="8">
                                        <LabelStyle Font="Trebuchet MS, 8.25pt, style=Bold" />
                                        <MajorGrid LineColor="64, 64, 64, 64" />
                                    </axisy>
                                    <axisx LineColor="64, 64, 64, 64"  LabelAutoFitMaxFontSize="8">
                                        <LabelStyle Font="Trebuchet MS, 8.25pt, style=Bold" />
                                        <MajorGrid LineColor="64, 64, 64, 64" />
                                    </axisx>
                                </asp:ChartArea>
                            </chartareas>
                        </asp:CHART>
            // Populate series data
            Random    random = new Random();
            for(int pointIndex = 0; pointIndex < 10; pointIndex++)
            {
                Chart1.Series["Series1"].Points.AddY(Math.Round((double)random.Next(45, 95),0));
                Chart1.Series["Series2"].Points.AddY(Math.Round((double)random.Next(5, 75),0));
                Chart1.Series["Series3"].Points.AddY(Math.Round((double)random.Next(5, 95),0));
                Chart1.Series["Series4"].Points.AddY(Math.Round((double)random.Next(35, 95),0));
            }

      string chartTypeName == "StackedArea"//"StackedArea100"//"StackedColumn"/"StackedColumn100"/"StackedBar"/"StackedBar100"
Chart1.Series["Series1"].ChartType = (SeriesChartType) Enum.Parse( typeof(SeriesChartType), chartTypeName, true );
Chart1.Series["Series2"].ChartType = (SeriesChartType) Enum.Parse( typeof(SeriesChartType), chartTypeName, true );
Chart1.Series["Series3"].ChartType = (SeriesChartType) Enum.Parse( typeof(SeriesChartType), chartTypeName, true );
Chart1.Series["Series4"].ChartType = (SeriesChartType) Enum.Parse( typeof(SeriesChartType), chartTypeName, true );