• vue echarts 雷达图(radar)动态获取数据并渲染


    一、给个容器

    二、获取数据

    mounted(){
                this._getCategory()
            },
    _getCategory(){
                getCategory().then(res=>{
                     let data = res.data.data
                     this.bookCategory(this.formatData(data))
                  })
              },
                formatData(data){
                    let indicator = []
                    let bookCat = []
                    let borrowCat = []
                    data.book.forEach(info => {
                        let key =  info.category;
                        let value = info.number;
                        bookCat[key] = value                 
                    })
                    let bookValues = Object.values(bookCat)       //book中的number组成的数组      
                    let bookMax = Math.max(...bookValues)
                    let bookKeys = Object.keys(bookCat)   //book数组中的category组成的数组
                    bookKeys.forEach(key => {
                        data.borrow.forEach(item=>{
                            if(item.category == key){
                                borrowCat[key] = item.number
                            }
                        })  
                    })
                    
                    let borrowValues = Object.values(borrowCat) 
                    let borrowMax = Math.max(...borrowValues)
                    let max = bookMax > borrowMax ? bookMax : borrowMax
                    bookKeys.forEach(item => indicator.push({
                        'name':item,
                        'max':max
                    }))
                    let result = {
                        indicator : indicator,
                        bookCat : bookValues,
                        borrowCat : borrowValues
                    }
                    return result
                },
                bookCategory(data){
                    let bookCategoryChart = echarts.init(document.getElementById('book-category'))
                    let option = {
                        tooltip: {
                            trigger: 'item',
                            position:function(p){    //其中p为当前鼠标的位置
                                return [p[0], p[1]];
                            },
                        },
                        legend: {
                            orient: 'vertical',
                            right: '5%',
                            textStyle: {
                                color:'#DFE0E5',
                                fontWeight: 'bold'
                            },
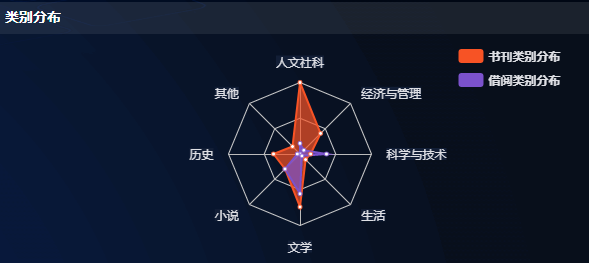
                            data: ['书刊类别分布', '借阅类别分布']
                        },
                        radar: {
                            splitNumber: 2, // 雷达图圈数设置
                            center: ['50%','50%'],
                            radius : '65%',
                            name: {
                                textStyle: {
                                    color: '#DFE0E5',
                                    backgroundColor: '#121E36'
                                }
                            },
                            indicator: data.indicator,
                            splitArea : {
                                show : false,
                                areaStyle : {
                                    color: 'rgba(255,0,0,0)', // 图表背景的颜色
                                },
                            },
                        },
                        series: [{
                            name: '书刊类别 vs 借阅类别',
                            type: 'radar',
                            data : [
                                {
                                    value : data.bookCat,
                                    name : '书刊类别分布',
                                    itemStyle: {
                                        normal: {
                                            color:'#F75325'  //显示颜色与填充颜色对应
                                        }
                                    },
                                    areaStyle: {
                                        normal: {
                                            color: '#F75325'    //填充的颜色
                                        }
                                    }
                                },
                                {
                                    value : data.borrowCat,
                                    name : '借阅类别分布',
                                    itemStyle: {
                                        normal: {
                                            color:'#7B52CC'
                                        }
                                    },
                                    areaStyle: {
                                        normal: {
                                            color: '#7B52CC'
                                        }
                                    }
                                }
                            ]
                        }]
                    };
                    bookCategoryChart.setOption(option)
                }

     五、效果如下:

  • 相关阅读:
    mysql 锁相关的视图(未整理)
    MYSQL的用户变量(@)和系统变量(@@)
    mysql杀死线程
    mysql 系统变量和session变量
    Oracle DB 移动数据
    MySQL数据库------常用函数
    练习-----查询
    练习建表
    课堂笔记总结
    数据库--------用代码来创建表
  • 原文地址:https://www.cnblogs.com/wangdashi/p/9442572.html
Copyright © 2020-2023  润新知