主题ps查看和调整优先级
一查看优先级
nice值越大优先级越低
[root@centos72 ~]# ps axo  pid,cmd,ni |  head
   PID CMD                          NI
     1 /usr/lib/systemd/systemd --   0
     2 [kthreadd]                    0
     3 [ksoftirqd/0]                 0
     5 [kworker/0:0H]              -20
     7 [migration/0]                 -
     8 [rcu_bh]                      0
     9 [rcu_sched]                   0
    10 [lru-add-drain]             -20
    11 [watchdog/0]                  -
[root@centos72 ~]# ps axo  pid,cmd,ni |   tail
  8406 [kworker/1:1]                 0
  8457 sshd: root@pts/3              0
  8465 -bash                         0
  8485 dd if=/dev/zero of=/dev/nul   0
  8573 [kworker/1:1H]              -20
 10541 [kworker/0:2]                 0
 11025 [kworker/0:1]                 0
 11295 [kworker/0:0]                 0
 11297 ps axo pid,cmd,ni             0
 11298 tail                          0
开启一个进程
[root@centos72 ~]#  ping  -f  127.0.0.1
PING 127.0.0.1 (127.0.0.1) 56(84) bytes of data.
^C
--- 127.0.0.1 ping statistics ---
4860967 packets transmitted, 4860967 received, 0% packet loss, time 44792ms
rtt min/avg/max/mdev = 0.001/0.003/14.741/0.028 ms, pipe 2, ipg/ewma 0.009/0.009 ms
按照CPU进行排序,CPU占用过高
[root@centos72 ~]# ps axo  pid,cmd,ni,%cpu   k  %cpu  | tail
  1142 -bash                         0  0.0
  1230 [kworker/0:1]                 0  0.0
  1253 [kworker/0:2]                 0  0.0
  1255 sshd: root@pts/1              0  0.0
  1259 -bash                         0  0.0
  1338 ps axo pid,cmd,ni,%cpu k %c   0  0.0
  1339 tail                          0  0.0
  1294 [kworker/0:0]                 0  0.1
   906 sshd: root@pts/0              0  0.2
  1283 ping -f 127.0.0.1             0 95.9
二调整优先级
注意此时进程正在运行
[root@centos72 ~]# ps axo  pid,cmd,ni,%cpu   k  %cpu  |  grep  ping
  1355 grep --color=auto ping        0  0.0
  1283 ping -f 127.0.0.1             0 96.0
[root@centos72 ~]#  renice  -n  -20  1283
1283 (process ID) old priority 0, new priority -20
[root@centos72 ~]# ps axo  pid,cmd,ni,%cpu   k  %cpu  |  grep  ping
  1358 grep --color=auto ping        0  0.0
  1283 ping -f 127.0.0.1           -20 95.8
注意此时进程正在运行
[root@centos72 ~]#  ping  -f  127.0.0.1
PING 127.0.0.1 (127.0.0.1) 56(84) bytes of data.
.^
--- 127.0.0.1 ping statistics ---
7827881 packets transmitted, 7827881 received, 0% packet loss, time 58781ms
rtt min/avg/max/mdev = 0.001/0.002/13.661/0.011 ms, pipe 2, ipg/ewma 0.007/0.006 ms
在执行命令的时候直接调整优先级
使用nice命令指定
[root@centos72 ~]# nice  -n  -5  ping  -f  127.0.0.1
PING 127.0.0.1 (127.0.0.1) 56(84) bytes of data.
^C
--- 127.0.0.1 ping statistics ---
3272228 packets transmitted, 3272228 received, 0% packet loss, time 26347ms
rtt min/avg/max/mdev = 0.001/0.003/8.853/0.015 ms, pipe 2, ipg/ewma 0.008/0.005 ms
[root@centos72 ~]#
[root@centos72 ~]#  ps axo  pid,cmd,ni,%cpu  | grep  ping
  1158 ping -f 127.0.0.1            -5 94.6
  1161 grep --color=auto ping        0  0.0
[root@centos72 ~]# nice  -n  5  ping  -f  127.0.0.1
PING 127.0.0.1 (127.0.0.1) 56(84) bytes of data.
[root@centos72 ~]#  ps axo  pid,cmd,ni,%cpu  | grep  ping
  1162 ping -f 127.0.0.1             5  110
  1164 grep --color=auto ping        0  0.0
优先级高并不一定更快
[root@centos72 ~]#  nice  -n  -11  ping  127.0.0.1
PING 127.0.0.1 (127.0.0.1) 56(84) bytes of data.
64 bytes from 127.0.0.1: icmp_seq=1 ttl=64 time=0.019 ms
64 bytes from 127.0.0.1: icmp_seq=2 ttl=64 time=0.030 ms
64 bytes from 127.0.0.1: icmp_seq=3 ttl=64 time=0.026 ms
^C
--- 127.0.0.1 ping statistics ---
3 packets transmitted, 3 received, 0% packet loss, time 1999ms
rtt min/avg/max/mdev = 0.019/0.025/0.030/0.004 ms
[root@centos72 ~]# ping  127.0.0.1
PING 127.0.0.1 (127.0.0.1) 56(84) bytes of data.
64 bytes from 127.0.0.1: icmp_seq=1 ttl=64 time=0.028 ms
64 bytes from 127.0.0.1: icmp_seq=2 ttl=64 time=0.027 ms
64 bytes from 127.0.0.1: icmp_seq=3 ttl=64 time=0.022 ms
64 bytes from 127.0.0.1: icmp_seq=4 ttl=64 time=0.023 ms
64 bytes from 127.0.0.1: icmp_seq=5 ttl=64 time=0.023 ms
^C
--- 127.0.0.1 ping statistics ---
5 packets transmitted, 5 received, 0% packet loss, time 3999ms
rtt min/avg/max/mdev = 0.022/0.024/0.028/0.006 ms
三注意事项——优先级之间的关系
(一)ni: nice值的优先级和pri优先级是相反的
nice值的优先级越高,那么对应的pri优先级越低
[root@centos72 ~]#  ps axo  pid,cmd,ni,%cpu,pri   | grep ping
  1283 ping -f 127.0.0.1           -20 96.2  39
  1360 grep --color=auto ping        0  0.0  19
[root@centos72 ~]#  ps axo  pid,cmd,ni,%cpu,pri  |  tail
  1099 [kworker/0:1]                 0  0.0  19
  1101 sshd: root@pts/2              0  0.7  19
  1105 -bash                         0  0.0  19
  1143 [kworker/1:1]                 0  0.0  19
  1159 [kworker/1:2]                 0  0.0  19
  1165 [kworker/0:0]                 0  0.0  19
  1183 [kworker/0:2]                 0  0.0  19
  1184 [kworker/1:0]                 0  0.0  19
  1190 ps axo pid,cmd,ni,%cpu,pri    0  0.0  19
  1191 -bash                         0  0.0  19
[root@centos72 ~]#  nice  -n  10  ping  127.0.0.1
PING 127.0.0.1 (127.0.0.1) 56(84) bytes of data.
64 bytes from 127.0.0.1: icmp_seq=1 ttl=64 time=0.025 ms
64 bytes from 127.0.0.1: icmp_seq=2 ttl=64 time=0.023 ms
64 bytes from 127.0.0.1: icmp_seq=3 ttl=64 time=0.027 ms
64 bytes from 127.0.0.1: icmp_seq=4 ttl=64 time=0.026 ms
64 bytes from 127.0.0.1: icmp_seq=5 ttl=64 time=0.026 ms
64 bytes from 127.0.0.1: icmp_seq=6 ttl=64 time=0.027 ms
64 bytes from 127.0.0.1: icmp_seq=7 ttl=64 time=0.026 ms
64 bytes from 127.0.0.1: icmp_seq=8 ttl=64 time=0.057 ms
64 bytes from 127.0.0.1: icmp_seq=9 ttl=64 time=0.023 ms
64 bytes from 127.0.0.1: icmp_seq=10 ttl=64 time=0.025 ms
64 bytes from 127.0.0.1: icmp_seq=11 ttl=64 time=0.024 ms
64 bytes from 127.0.0.1: icmp_seq=12 ttl=64 time=0.026 ms
64 bytes from 127.0.0.1: icmp_seq=13 ttl=64 time=0.024 ms
64 bytes from 127.0.0.1: icmp_seq=14 ttl=64 time=0.037 ms
64 bytes from 127.0.0.1: icmp_seq=15 ttl=64 time=0.023 ms
^C
--- 127.0.0.1 ping statistics ---
15 packets transmitted, 15 received, 0% packet loss, time 14000ms
rtt min/avg/max/mdev = 0.023/0.027/0.057/0.011 ms
[root@centos72 ~]#  ps axo  pid,cmd,ni,%cpu,pri  |  tail
  1101 sshd: root@pts/2              0  0.7  19
  1105 -bash                         0  0.0  19
  1143 [kworker/1:1]                 0  0.0  19
  1159 [kworker/1:2]                 0  0.0  19
  1165 [kworker/0:0]                 0  0.0  19
  1183 [kworker/0:2]                 0  0.0  19
  1184 [kworker/1:0]                 0  0.0  19
  1192 ping 127.0.0.1               10  0.0   9
  1193 ps axo pid,cmd,ni,%cpu,pri    0  0.0  19
  1194 tail                          0  0.0  19
[root@centos72 ~]#  nice  -n  -10  ping  127.0.0.1
PING 127.0.0.1 (127.0.0.1) 56(84) bytes of data.
64 bytes from 127.0.0.1: icmp_seq=1 ttl=64 time=0.021 ms
64 bytes from 127.0.0.1: icmp_seq=2 ttl=64 time=0.028 ms
64 bytes from 127.0.0.1: icmp_seq=3 ttl=64 time=0.027 ms
64 bytes from 127.0.0.1: icmp_seq=4 ttl=64 time=0.023 ms
64 bytes from 127.0.0.1: icmp_seq=5 ttl=64 time=0.023 ms
64 bytes from 127.0.0.1: icmp_seq=6 ttl=64 time=0.023 ms
^C
--- 127.0.0.1 ping statistics ---
6 packets transmitted, 6 received, 0% packet loss, time 4999ms
rtt min/avg/max/mdev = 0.021/0.024/0.028/0.003 ms
[root@centos72 ~]#  ps axo  pid,cmd,ni,%cpu,pri  |  tail
  1101 sshd: root@pts/2              0  0.6  19
  1105 -bash                         0  0.0  19
  1143 [kworker/1:1]                 0  0.0  19
  1159 [kworker/1:2]                 0  0.0  19
  1165 [kworker/0:0]                 0  0.0  19
  1183 [kworker/0:2]                 0  0.0  19
  1184 [kworker/1:0]                 0  0.0  19
  1195 ping 127.0.0.1              -10  0.0  29
  1196 ps axo pid,cmd,ni,%cpu,pri    0  0.0  19
  1197 tail                          0  0.0  19
注意帮助文档的此说明并不准确
[root@centos72 ~]# man  ps  | grep  PRI
       pri         PRI       priority of the process.  Higher number means lower priority.
       rtprio      RTPRIO    realtime priority.
数字越大优先级越高
所以帮助文档是有一定的bug的,不要迷信权威
[root@centos72 ~]# ps -C  ping  o   pid,cmd,ni,%cpu,pri
   PID CMD                          NI %CPU PRI
  1246 ping 127.0.0.1               10  0.0   9
  1248 ping 127.0.0.1              -10  0.0  29
在6上没有PRI的相关说明
[root@centos65 ~]# man  ps  | grep  PRI
rtprio     RTPRIO   realtime priority.
(二)pri的优先级的值和早期系统优先级相反
也就是从139到0,早期的系统优先级是从0到139
所以pri的值越大优先级越高
[root@centos72 ~]#  nice  -n  30  ping  127.0.0.1
[root@centos72 ~]#  ps axo  pid,cmd,ni,%cpu,pri  |  tail
  1058 ping 8.8.8.8                  0  0.0  19
  1059 sshd: root@pts/1              0  0.1  19
  1063 -bash                         0  0.0  19
  1086 sshd: root@pts/2              0  0.6  19
  1090 -bash                         0  0.0  19
  1110 [kworker/1:1]                 0  0.0  19
  1113 [kworker/0:0]                 0  0.0  19
  1114 ping 127.0.0.1               19  0.0   0
  1118 ps axo pid,cmd,ni,%cpu,pri    0  0.0  19
  1119 tail                          0  0.0  19
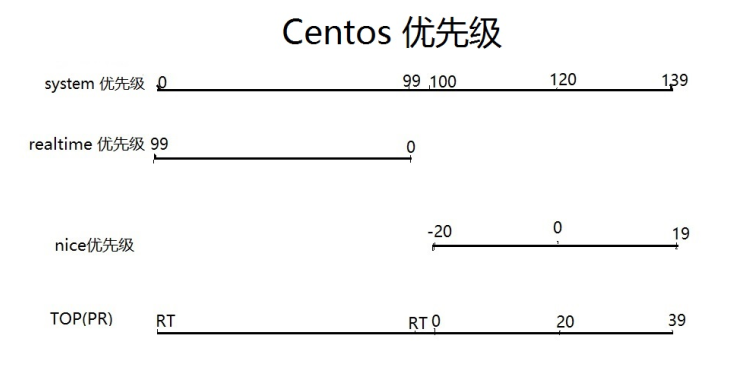
(三)实时优先级rtprio和nice优先级关系
从下图可以看出实时优先级和nice优先级对应系统优先级的一部分,实时优先级和nice优先级是没有交集的
ncie优先级又被称为动态优先级,比如占用的内存太多了就会自动的把优先级调小。
实时优先级是静态的优先级,指定好了就固定不变了。
调整实时优先级使用chrt
rtprio: 实时优先级
因为nice优先级不对应任何的实时优先级,所以无法显示实时优先级
[root@centos72 ~]#  nice  -n  -20 ping  127.0.0.1
PING 127.0.0.1 (127.0.0.1) 56(84) bytes of data.
64 bytes from 127.0.0.1: icmp_seq=1 ttl=64 time=0.034 ms
64 bytes from 127.0.0.1: icmp_seq=2 ttl=64 time=0.026 ms
64 bytes from 127.0.0.1: icmp_seq=3 ttl=64 time=0.022 ms
^C
--- 127.0.0.1 ping statistics ---
3 packets transmitted, 3 received, 0% packet loss, time 2000ms
rtt min/avg/max/mdev = 0.022/0.027/0.034/0.006 ms
[root@centos72 ~]#  ps  -C  ping  o   pid,cmd,ni,%cpu,pri,rtprio  |  tail
   PID CMD                          NI %CPU PRI RTPRIO
  1260 ping 127.0.0.1              -20  0.0  39      -
7 [migration/0] - 0.0 139 99中139是最高的优先级,值越大优先级越高,
因为是pri优先级,和系统优先级是相反的
[root@centos72 ~]#  ps  axo   pid,cmd,ni,%cpu,pri,rtprio  |  head
   PID CMD                          NI %CPU PRI RTPRIO
     1 /usr/lib/systemd/systemd --   0  0.0  19      -
     2 [kthreadd]                    0  0.0  19      -
     3 [ksoftirqd/0]                 0  0.0  19      -
     5 [kworker/0:0H]              -20  0.0  39      -
     6 [kworker/u256:0]              0  0.0  19      -
     7 [migration/0]                 -  0.0 139     99
     8 [rcu_bh]                      0  0.0  19      -
     9 [rcu_sched]                   0  0.0  19      -
    10 [lru-add-drain]             -20  0.0  39      -
看门狗监控内核状态的,最高优先级
就像国家的安全部分监控其他部门,比如明朝的锦衣卫
[root@centos72 ~]#  ps  axo   pid,cmd,ni,%cpu,pri,rtprio  |  grep  watch
    11 [watchdog/0]                  -  0.0 139     99
    12 [watchdog/1]                  -  0.0 139     99
  1272 grep --color=auto watch       0  0.0  19      -