最先发布在csdn。本人原创。 https://blog.csdn.net/weixin_43906799/article/details/105510046
SJF算法:
最短作业优先(SJF)调度算法将每个进程与其下次 CPU 执行的长度关联起来。实际上,短进程/作业(要求服务时间最短)在实际情况中占有很大比例,为了使得它们优先执行,追求最少的平均等待时间时间、平均周转时间、平均带权周转时间。短作业优先可能导致长作业一直得不到处理)
总体构想
用python绘图这个想法产生于写调度图作业那段时间。当时就想着用python绘图,有两个想法trutle动态绘制调度图,还有就是现在所使用的方法。为什么用类写这次的作业,一是下次的作业可以直接继承SJF类,然后修改调度函数和排序函数就行了。二是用类写代码解决一类问题,代码看起来比较漂亮。
算法设计结构图


程序执行结果图

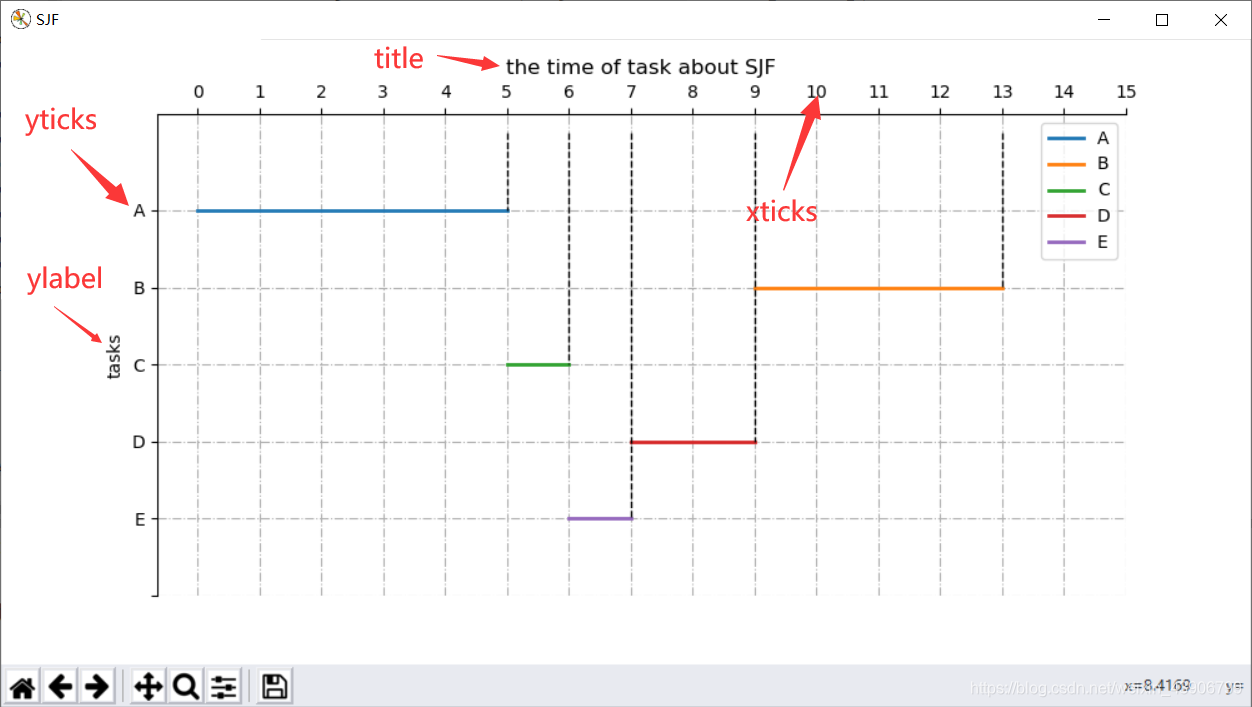
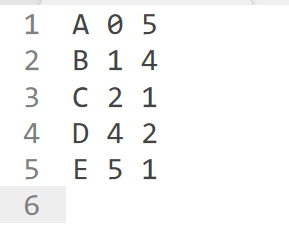
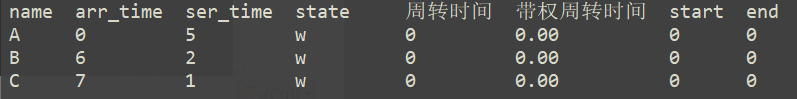
作业信息
| 作业名 | 到达时间 | 运行时间 |
|---|---|---|
| A | 0 | 5 |
| B | 1 | 4 |
| C | 2 | 1 |
| D | 4 | 2 |
| E | 5 | 1 |
基本思路
(1)类初始化:
对于进程调度SJF算法这个类,首先我们需要有成员变量,也就是大致所需要的成员变量。 基本也就需要这么多。
| self.data = [] | 存储进程 |
|---|---|
| self.name = '' | 进程名字 |
| self.service_time = 0 | 服务时间 |
| self.arrival_time = 0 | 到达时间 |
| self.state = '' | 初始状态 |
| self.number = 0 | 进程数量 |
| self.timeout = 0 | 超时限定 |
| self.start = 0 | 开始时间 |
| self.end = 0 | 结束时间 |
 copydef __init__(self):
         super(Solution, self).__init__()
         # save tasks
         self.data = []
         self.name = ''
         self.service_time = 0
         self.arrival_time = 0
         self.state = ''
         self.number = 0
         self.timeout = 0
         self.start = 0
         self.end = 0
(2)获取数据:
获取数据可以从文件(如.txt)中读入,亦可以从console读入。这里要求一个地方,就是数据的格式,名字,到达时间,服务时间。中间用空格分开。如下面表格:
| name | arrival_time | service_time |
|---|---|---|
| A | 0 | 5 |
| B | 1 | 4 |
| C | 2 | 1 |
| D | 4 | 2 |
| E | 5 | 1 |
copydef get_data_file(self):
with open('data.txt', "r", encoding="utf-8") as file:
for line in file.read().splitlines():
name, arrival_time, service_time = line.split()
# insert the task
self.insert_data(name, arrival_time, service_time)
file.close()
# initial queue
# sort first arrival_time and second service_time
self.data.sort(key=lambda x: (x['arrival_time'], x['service_time']))
# update and recode id
for i in range(self.number):
self.data[i]['index'] = i
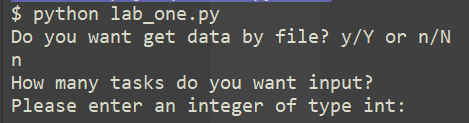
def get_data_input(self):
print('How many tasks do you want input?')
tasks_number = int(input('Please enter an integer of type int:'))
print('Please enter name and arrival_time and service_time of task')
print('such as:A 0 5')
for _ in range(tasks_number):
name, arrival_time, service_time = input('Please enter
').split()
self.insert_data(name, arrival_time, service_time)
# initial queue
# sort first arrival_time and second service_time
self.data.sort(key=lambda x: (x['arrival_time'], x['service_time']))
# update and recode id
for i in range(self.number):
self.data[i]['index'] = i
(3)进行调度:
也就是设计算法,来实现SJF。基本的算法思路,就是维护一个优先队列。如图:
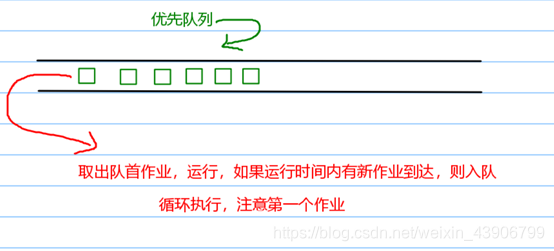
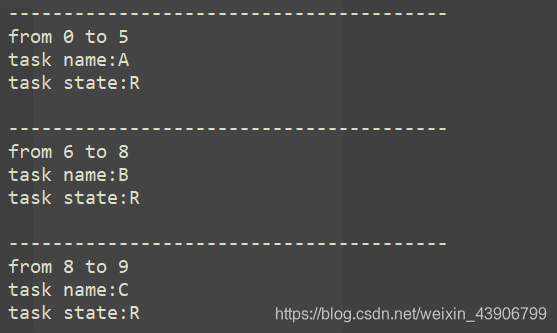
每次调度的时候根据需要,然后更新信息,更改作业的状态和到达和结束的时间。同时获取下一个或者多个作业,这里需要考虑到一种情况,就是当前时间片不能获取下一个作业,需要等待一段时间作业到达,才能执行。这种情况特判一下。然后执行排序,维护这个优先队列。
 copydef implement(self):
         '''start algorithm'''
         # get first task
         data = [self.data[0]]
         # update the time of start
         self.start = self.end = data[0]['arrival_time']
         while data:
             # update information
             self.update_information(
                 data[0]['index'], self.end, self.end + data[0]['service_time'])
             # get next task or tasks
             data += self.get_next_data(data.pop(0)['index'], data)
             # maintain the queue
             data = self.sort_data(data)
         self.data.sort(key=lambda x: x['id'])
(4)排序和信息更新:
对于排序的实现其实很简单,前面的结构图也已经展示了,对于SJF算法一共有两种排序方式,分别在不同的过程进行使用。数据更新就是更新原始的数据,包括计算状态,开始时间,结束时间,周转时间,平均周转时间等等。
 copydef update_information(self, index, start, end):
         self.data[index]['start'] = start
         self.data[index]['end'] = end
         self.data[index]['state'] = 'f'
         self.data[index]['turnaround_time'] = end -
             self.data[index]['arrival_time']
         self.data[index]['authorized_turnover_time'] = self.data[index]['turnaround_time'] /
             self.data[index]['service_time']
         self.start = start
         self.end = end
         self.show_data_running(start, end, self.data[index])
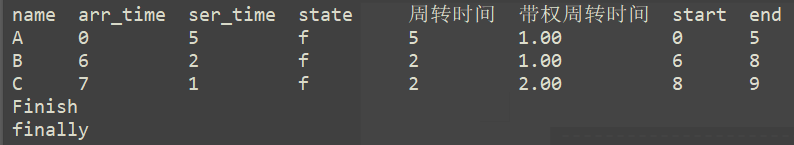
(5)数据输出:
为什么要数据输出,其实这就是一个数据可视化的一种方法。也就是直观的表达各种信息。所以数据输出部分,就是自己设置自己的排版,布局,可以利用 制表符来打表。
 copydef show_data(self):
         print("{:<6}{:<10}{:<10}{:<10}{:<6}{:<8}{:<7}{:<6}".format(
             'name', 'arr_time', 'ser_time', 'state', '周转时间', '带权周转时间', 'start', 'end'))
         for task in sorted(self.data, key=lambda x: x['id']):
             print("{:<6}{:<10}{:<10}{:<10}{:<10}{:<14.2f}{:<7}{:<4}".format(
                 task['name'],
                 task['arrival_time'],
                 task['service_time'],
                 task['state'],
                 task['turnaround_time'],
                 task['authorized_turnover_time'],
                 task['start'],
                 task['end']))
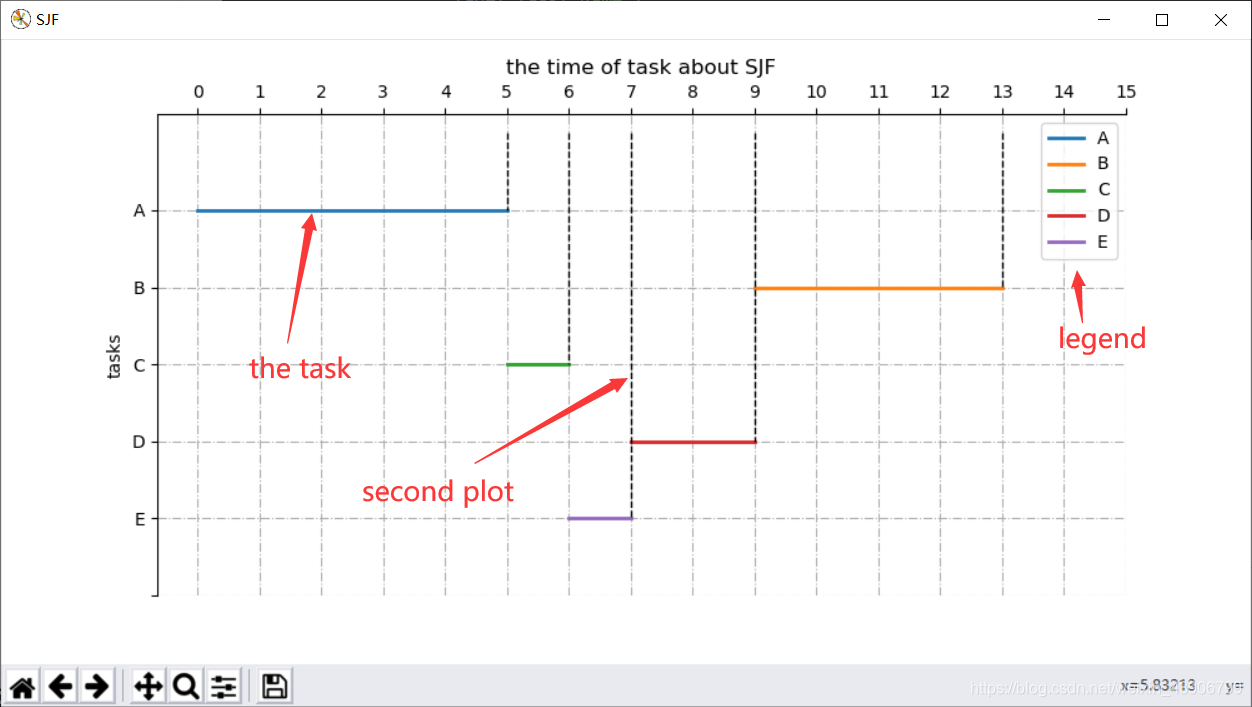
(6)plt生成调度图展示:
利用python的第三方库,根据数据进行绘图,然后展示出好看的图片。
copydef init_image(self):
# size = 1000 * 500
plt.figure('SJF', figsize=(10, 5))
self.drow_image()
# setting xticks for 0 to self.end + 2
plt.xticks([i for i in range(self.end + 3)])
# setting title
plt.title('the time of task about SJF')
plt.xlabel('')
plt.ylabel('tasks')
# setting yticks.such as A == 0
plt.yticks(self.get_y_ticks()[0], self.get_y_ticks()[1])

 copydef drow_image(self):
         for task in self.data:
             # the time line of task from start to end
             plt.plot([task['start'], task['end']],
                      [task['id'], task['id']],
                      label=task['name'],
                      lw=2)
             # annotation of the key point
             plt.plot([task['end'], task['end']],
                      [-1, task['id']],
                      'k--',
                      lw=1)
         # legend
         plt.legend(loc='best')

 copydef set_ax(self):
         ax = plt.gca()  # 获取到当前坐标轴信息
         ax.spines['right'].set_color('none')
         ax.spines['bottom'].set_color('none')
         ax.xaxis.set_ticks_position('top')   # 将X坐标轴移到上面
         ax.invert_yaxis()  # 反转Y坐标轴
         ax.grid(True, linestyle='-.')  # 网格
copydef show_image(self):
        self.init_image()
        self.set_ax()
        plt.savefig('SJF.png', dpi=300)
        plt.show()
程序执行过程:
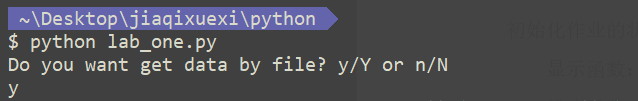
支持两种输入方式,手动输入和数据导入。
数据导入:
原始数据
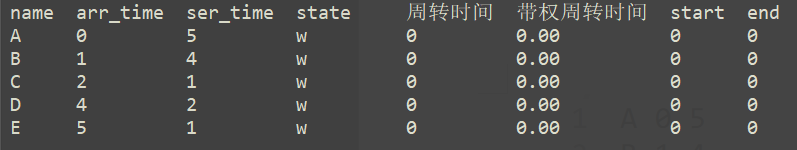
调度前:
调度中:

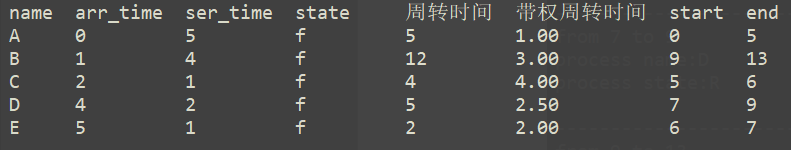
调度后:
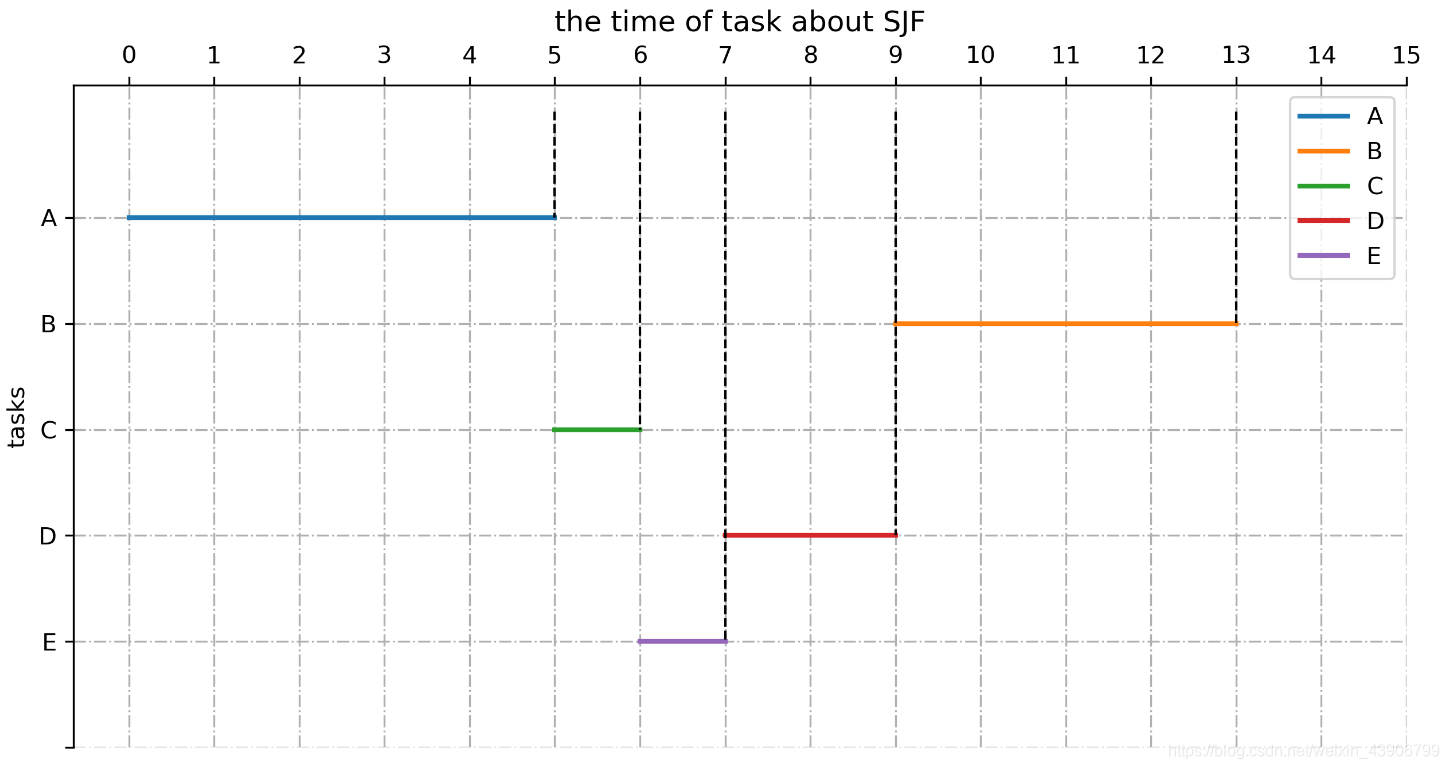
生成调度图:
手动输入数据:

调度前
 调度中
调度中
调度后
生成调度图:

程序源代码:
copy# -*- coding: utf-8 -*-
# @Author: wfy
# @Date: 2020-04-10 15:31:44
# @Last Modified by: wfy
# @Last Modified time: 2020-04-14 13:46:31
import matplotlib.pyplot as plt
class Solution():
"""to achieve SJF"""
def __init__(self):
super(Solution, self).__init__()
# save tasks
self.data = []
self.name = ''
self.service_time = 0
self.arrival_time = 0
self.state = ''
self.number = 0
self.timeout = 0
self.start = 0
self.end = 0
def insert_data(self, name, arrival_time, service_time):
self.data.append({
'id': self.number,
'name': name,
'arrival_time': int(arrival_time),
'service_time': int(service_time),
'state': 'w',
'turnaround_time': 0,
'authorized_turnover_time': 0,
'start': 0,
'end': 0
})
self.timeout = max(self.timeout, int(arrival_time))
self.number += 1
def get_data_file(self):
with open('data.txt', "r", encoding="utf-8") as file:
for line in file.read().splitlines():
name, arrival_time, service_time = line.split()
# insert the task
self.insert_data(name, arrival_time, service_time)
file.close()
# initial queue
# sort first arrival_time and second service_time
self.data.sort(key=lambda x: (x['arrival_time'], x['service_time']))
# update and recode id
for i in range(self.number):
self.data[i]['index'] = i
def get_data_input(self):
print('How many tasks do you want input?')
tasks_number = int(input('Please enter an integer of type int:'))
print('Please enter name and arrival_time and service_time of task')
print('such as:A 0 5')
for _ in range(tasks_number):
name, arrival_time, service_time = input('Please enter
').split()
self.insert_data(name, arrival_time, service_time)
# initial queue
# sort first arrival_time and second service_time
self.data.sort(