echars多坐标轴曲线
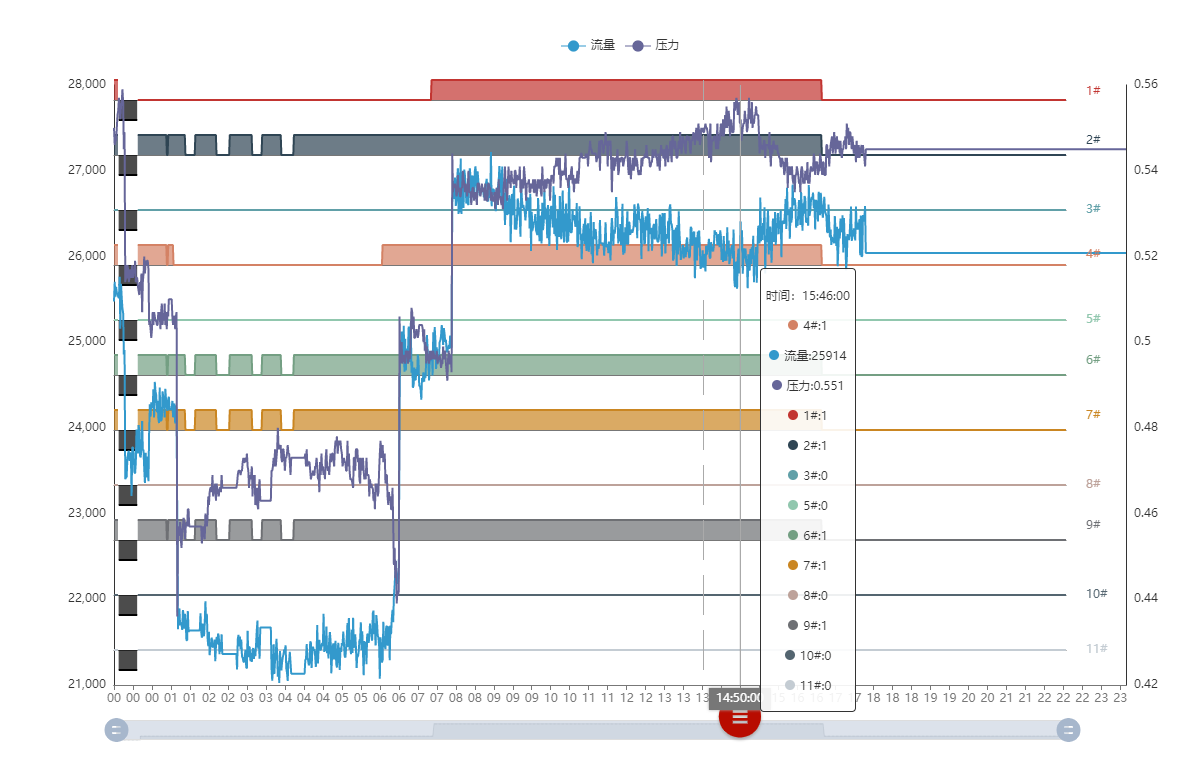
1.效果如下:
2.源码如下:


1 <template> 2 <div class="chart"></div> 3 </template> 4 <script> 5 import Bus from "@/utils/bus.js"; 6 import { debounce } from "@/utils"; 7 export default { 8 name: "echartsActual", 9 data() { 10 return { 11 autoResize: { 12 type: Boolean, 13 default: true, 14 }, 15 chart: null, 16 sidebarElm: null, 17 chartData: {}, 18 imgtest: require("../assets/test2.jpg"), 19 fullImage: "", 20 }; 21 }, 22 mounted() { 23 Bus.$on("WaterworksDispatchCurveData_Actual_To", (e) => { 24 //Actual_FlowData,Actual_PressureData,Actual_PumpCurveData 25 console.log("传过来的数据7", e); 26 27 let Actual_FlowData = e.Actual_FlowData, 28 Actual_PressureData = e.Actual_PressureData, 29 Actual_Time = e.Actual_Time;//流量,压力,时间 30 let colorList = [ 31 "#c23531", 32 "#2f4554", 33 "#61a0a8", 34 "#d48265", 35 "#91c7ae", 36 "#749f83", 37 "#ca8622", 38 "#bda29a", 39 "#6e7074", 40 "#546570", 41 "#c4ccd3", 42 "#990066", 43 "#FFCC00", 44 "#CC0033", 45 "#FFCC33", 46 "#333399", 47 "#FF0033", 48 "#666699", 49 "#FFFF00", 50 "#FF0033", 51 "#FF6600", 52 ];//颜色集合 53 //PumpData Time PumpNo 54 /***** 水泵曲线配置项处理开始 *******/ 55 let gridIndexArray = []; 56 let newxAxis = []; 57 let newyAxis = []; 58 let newgrid = []; 59 let newseries = []; 60 let PumpNoArray = []; 61 e.Actual_PumpCurveData.map((ele, index) => { 62 gridIndexArray.push(index); 63 PumpNoArray.push(ele.PumpNo); 64 newxAxis.push( 65 index !== e.length - 1 66 ? { 67 type: "category", 68 gridIndex: index, 69 data: ele.Time, 70 boundaryGap: false, 71 axisLine: { lineStyle: { color: "#777" } }, 72 axisTick: { show: false }, 73 axisLabel: { 74 show: false, 75 formatter: function (value) { 76 return ""; 77 }, 78 }, 79 // min: 'dataMin', 80 // max: 'dataMax', 81 axisPointer: { 82 show: true, 83 label: { show: false }, 84 }, 85 } 86 : { 87 type: "category", 88 gridIndex: index, 89 data: ele.Time, 90 scale: true, 91 boundaryGap: false, 92 splitLine: { show: false }, 93 axisLabel: { show: false }, 94 axisTick: { show: false }, 95 axisLine: { lineStyle: { color: "#777" } }, 96 // splitNumber: 20, 97 // min: 'dataMin', 98 // max: 'dataMax', 99 axisPointer: { 100 type: "shadow", 101 label: { show: true }, 102 triggerTooltip: true, 103 handle: { 104 show: true, 105 margin: 30, 106 color: "#B80C00", 107 }, 108 }, 109 } 110 ); 111 newyAxis.push({ 112 scale: true, 113 gridIndex: index, 114 max: 1, 115 min: -1, 116 // splitNumber: 2, 117 axisLabel: { show: false }, 118 axisLine: { show: false }, 119 axisTick: { show: false }, 120 splitLine: { show: false }, 121 }); 122 newgrid.push({ 123 left: 60, 124 right: 120, 125 top: 55 * (index + 1), 126 bottom: 60, 127 height: 40, 128 }); 129 newseries.push( 130 { 131 // name: e.PumpNo, //PumpDataNull 132 type: "line", 133 symbol: "none", 134 id: `series${index}`, 135 data: ele.PumpData, 136 xAxisIndex: index, 137 yAxisIndex: index, 138 itemStyle: { 139 color: colorList[index], 140 }, 141 emphasis: { 142 itemStyle: { 143 color: colorList[index], 144 }, 145 }, 146 areaStyle: { 147 normal: { 148 color: colorList[index], 149 }, 150 }, 151 lineStyle: { 152 color: colorList[index], 153 // 2 154 }, 155 markLine: { 156 data: [{ type: "average", name: "平均值" }], 157 symbol: ["none", "none"], 158 label: { 159 show: true, 160 formatter: `${index + 1}#`, 161 distance: [20, 0], 162 }, 163 lineStyle: { 164 color: colorList[index], 165 0, 166 }, 167 }, 168 }, 169 { 170 //name: gridIndexArray[index],// 171 type: "line", 172 symbol: "none", 173 data: ele.PumpDataNull, 174 xAxisIndex: index, 175 yAxisIndex: index, 176 tooltip: { show: false }, 177 itemStyle: { 178 color: "#000", 179 }, 180 emphasis: { 181 itemStyle: { 182 color: "#000", 183 }, 184 }, 185 areaStyle: { 186 normal: { 187 color: "#000", 188 }, 189 }, 190 lineStyle: { 191 color: "#000", 192 // 2 193 }, 194 } 195 ); 196 /* */ 197 }); 198 /***** 水泵曲线配置项处理结束 *******/ 199 /***** 流量、压力曲线配置项处理开始 *******/ 200 newxAxis.push( 201 { 202 type: "category", 203 gridIndex: gridIndexArray.length, 204 data: Actual_Time, 205 boundaryGap: false, 206 axisLine: { lineStyle: { color: "#777" } }, 207 axisLabel: { 208 formatter: function (value) { 209 return value.split(":")[0]; 210 }, 211 }, 212 // min: 'dataMin', 213 // max: 'dataMax', 214 axisPointer: { 215 show: true, 216 label: { show: false }, 217 }, 218 }, 219 { 220 type: "category", 221 gridIndex: gridIndexArray.length + 1, 222 data: Actual_Time, 223 scale: true, 224 boundaryGap: false, 225 splitLine: { show: false }, 226 axisLabel: { show: false }, 227 axisTick: { show: false }, 228 axisLine: { lineStyle: { color: "#777" } }, 229 // splitNumber: 20, 230 // min: 'dataMin', 231 // max: 'dataMax', 232 axisPointer: { 233 type: "shadow", 234 label: { show: true }, 235 triggerTooltip: true, 236 handle: { 237 show: true, 238 margin: 30, 239 color: "#B80C00", 240 }, 241 }, 242 } 243 ); 244 newyAxis.push( 245 { 246 scale: true, 247 gridIndex: gridIndexArray.length, 248 // max: 1, 249 // min: -1, 250 // splitNumber: 2, 251 axisLabel: { show: true }, 252 axisLine: { show: true }, 253 axisTick: { show: false }, 254 splitLine: { show: false }, 255 }, 256 { 257 scale: true, 258 gridIndex: gridIndexArray.length + 1, 259 position: "right", 260 offset: 0, 261 // max: 1, 262 // min: -1, 263 // splitNumber: 2, 264 axisLabel: { show: true }, 265 axisLine: { show: true }, 266 axisTick: { show: false }, 267 splitLine: { show: false }, 268 } 269 ); 270 newgrid.push( 271 { 272 left: 60, 273 right: 60, 274 top: 60, 275 bottom: 60, 276 height: 60 * (gridIndexArray.length - 1), 277 }, 278 { 279 left: 60, 280 right: 60, 281 top: 60, 282 bottom: 60, 283 height: 60 * (gridIndexArray.length - 1), 284 } 285 ); 286 newseries.push( 287 { 288 name: "流量", //PumpDataNull 289 type: "line", 290 symbol: "none", 291 id: `flow`, 292 data: Actual_FlowData, 293 xAxisIndex: gridIndexArray.length, 294 yAxisIndex: gridIndexArray.length, 295 itemStyle: { 296 color: "#3399CC", // colorList[gridIndexArray.length], 297 }, 298 emphasis: { 299 itemStyle: { 300 color: "#3399CC", // colorList[gridIndexArray.length], 301 }, 302 }, 303 304 lineStyle: { 305 color: "#3399CC", // colorList[gridIndexArray.length], 306 // 2 307 }, 308 }, 309 { 310 name: "压力", //PumpDataNull 311 type: "line", 312 symbol: "none", 313 id: `Pressure`, 314 data: Actual_PressureData, 315 xAxisIndex: gridIndexArray.length + 1, 316 yAxisIndex: gridIndexArray.length + 1, 317 itemStyle: { 318 color: "#666699", //colorList[gridIndexArray.length + 1], 319 }, 320 emphasis: { 321 itemStyle: { 322 color: "#666699", //colorList[gridIndexArray.length + 1], 323 }, 324 }, 325 326 lineStyle: { 327 color: "#666699", //colorList[gridIndexArray.length + 1], 328 // 2 329 }, 330 } 331 ); 332 /***** 流量、压力曲线配置项处理结束 *******/ 333 gridIndexArray.push(gridIndexArray.length, gridIndexArray.length + 1); 334 PumpNoArray.push("流量", "压力"); 335 /***** 添加流量、压力曲线坐标系索引,图例 *******/ 336 /***** 绘制所有曲线开始 *******/ 337 let Option = { 338 animation: false, 339 legend: { 340 top: 10, 341 bottom: 60, 342 z: 200, 343 data: PumpNoArray, 344 }, 345 tooltip: { 346 // triggerOn: "none", 347 transitionDuration: 0, 348 confine: true, 349 bordeRadius: 4, 350 borderWidth: 1, 351 borderColor: "#333", 352 backgroundColor: "rgba(255,255,255,0.9)", // 353 //formatter: '{a}: {c1}', 354 formatter: (params) => { 355 console.log(params); 356 //seriesId 357 var res = "<div> <p> 时间:" + params[0].name + " </p> </div>"; 358 for (var i = 0; i < params.length; i++) { 359 // //console.log(params[i].seriesId) 360 // console.log(params[i].seriesId.substring(0, 6)); 361 // console.log(params[i].seriesId.substring(7)); 362 if (params[i].seriesId.substring(0, 6) === "series") { 363 res += `<p> 364 ${params[i].marker}${params[i].seriesIndex / 2 + 1}#:${ 365 params[i].data 366 } 367 </p>`; 368 } else if (params[i].seriesName === "流量") { 369 res += `<p> 370 ${params[i].marker}${params[i].seriesName}:${params[i].data} 371 </p>`; 372 } else if (params[i].seriesName === "压力") { 373 res += `<p> 374 ${params[i].marker}${params[i].seriesName}:${params[i].data} 375 </p>`; 376 } 377 } 378 return res; 379 }, 380 textStyle: { 381 fontSize: 12, 382 color: "#333", 383 }, 384 // position: function (pos, params, el, elRect, size) { 385 // var obj = { 386 // top: 60, 387 // }; 388 // obj[["left", "right"][+(pos[0] < size.viewSize[0] / 2)]] = 5; 389 // return obj; 390 // }, 391 }, 392 axisPointer: { 393 link: [ 394 { 395 xAxisIndex: gridIndexArray, 396 }, 397 ], 398 }, 399 400 dataZoom: [ 401 { 402 type: "slider", 403 xAxisIndex: gridIndexArray, 404 realTime: false, 405 start: 0, 406 end: 100, 407 bottom: 45, 408 height: 20, 409 handleIcon: 410 "path://M10.7,11.9H9.3c-4.9,0.3-8.8,4.4-8.8,9.4c0,5,3.9,9.1,8.8,9.4h1.3c4.9-0.3,8.8-4.4,8.8-9.4C19.5,16.3,15.6,12.2,10.7,11.9z M13.3,24.4H6.7V23h6.6V24.4z M13.3,19.6H6.7v-1.4h6.6V19.6z", 411 handleSize: "120%", 412 }, 413 { 414 type: "inside", 415 xAxisIndex: gridIndexArray, 416 start: 0, 417 end: 100, 418 bottom: 45, 419 height: 20, 420 }, 421 ], 422 xAxis: newxAxis, 423 424 yAxis: newyAxis, 425 grid: newgrid, 426 series: newseries, 427 /***** 绘制所有曲线结束 *******/ 428 }; 429 /* 赋值 */ 430 this.chartData = Option; 431 /* 调用绘制曲线方法 */ 432 this.$nextTick(() => { 433 setTimeout(() => { 434 this.initChart(); 435 }, 500); 436 }); 437 }); 438 }, 439 beforeDestroy() { 440 if (!this.chart) { 441 return; 442 } 443 if (this.autoResize) { 444 window.removeEventListener("resize", this.__resizeHandler); 445 } 446 447 this.sidebarElm && 448 this.sidebarElm.removeEventListener( 449 "transitionend", 450 this.sidebarResizeHandler 451 ); 452 453 this.chart.dispose(); 454 this.chart = null; 455 }, 456 methods: { 457 initChart() { 458 this.chart = this.$echarts.init(this.$el, "macarons"); 459 this.chart.clear(); 460 this.setOptions(this.chartData); 461 this.chart.on("click", function (a) { 462 alert(a); 463 console.log("this.chart.mouseover"); 464 }); 465 // this.chart.on("mouseover", function(a) { 466 // console.log("this.chart.mouseover"); 467 // }); 468 // this.chart.on("mouseout", function() { 469 // emphasis(); 470 // }); 471 }, 472 473 setOptions(chartData) { 474 this.chart.setOption(chartData); 475 }, 476 sidebarResizeHandler(e) { 477 if (e.propertyName === "width") { 478 this.__resizeHandler(); 479 } 480 }, 481 //窗口改变执行方法 482 resetSizefun() { 483 if (this.autoResize) { 484 this.__resizeHandler = debounce(() => { 485 if (this.chart) { 486 this.chart.resize(); 487 } 488 }, 100); 489 window.addEventListener("resize", this.__resizeHandler); 490 } 491 492 // 监听侧边栏的变化 493 this.sidebarElm = document.getElementsByClassName("sidebar-container")[0]; 494 this.sidebarElm && 495 this.sidebarElm.addEventListener( 496 "transitionend", 497 this.sidebarResizeHandler 498 ); 499 }, 500 }, 501 }; 502 </script> 503 <style lang="scss" scoped> 504 .chart { 505 // border: 1px #B4C5D4 solid; 506 // background: #D9E5EF; 507 margin-top: 10px; 508 100%; 509 height: 760px; 510 } 511 </style>