首先是在前台写一个框选的js函数,然后将获得的四个顶点的坐标通过callback函数传到后台,如下进行:
public static string VerticalAnaysis(double Xmin, double Ymin, double Xmax, double Ymax,ESRI.ArcGIS.ADF.Web.UI.WebControls.Map map)
{
try
{
ESRI.ArcGIS.ADF.Web.Geometry.Envelope pEnve = new ESRI.ArcGIS.ADF.Web.Geometry.Envelope(Xmin, Ymin, Xmax, Ymax);
object[] oa = new object[1];
if (map.Scale > 8000)
{
oa[0] = "Ext.MessageBox.alert('提示','为了使用纵断面分析,请把地图比例尺放大到8000以内');";
CallbackResult pRst = new CallbackResult(null, null, "javascript", oa);
map.CallbackResults.Add(pRst);
return map.CallbackResults.ToString(); ;
}
ESRI.ArcGIS.ADF.Web.DataSources.IMapFunctionality pMapFun = (ESRI.ArcGIS.ADF.Web.DataSources.IMapFunctionality)map.GetFunctionality("管线");
ESRI.ArcGIS.ADF.Web.DataSources.IGISResource pMapRes = pMapFun.Resource;
string sJS = string.Empty;
if (pMapRes.SupportsFunctionality(typeof(IQueryFunctionality)))
{
IQueryFunctionality pQueryFun = pMapRes.CreateFunctionality(typeof(IQueryFunctionality), null) as IQueryFunctionality;
string[] sLyrIDs, sLyrNames;
pQueryFun.GetQueryableLayers(null, out sLyrIDs, out sLyrNames, ESRI.ArcGIS.ADF.Web.FeatureType.Line);
if (sLyrNames.Length > 0)
{
string m_VCrsLyrname = String.Empty;
ArrayList pRowLst = null;
if (map.Page.Session["VCrossLyrName"] != null)
m_VCrsLyrname = map.Page.Session["VCrossLyrName"].ToString();
if (map.Page.Session["VCrossLst"] != null)
pRowLst = map.Page.Session["VCrossLst"] as ArrayList;
ESRI.ArcGIS.ADF.Web.SpatialFilter pQFilter = new ESRI.ArcGIS.ADF.Web.SpatialFilter();
pQFilter.MaxRecords = 100;
pQFilter.ReturnADFGeometries = true;
pQFilter.Geometry = pEnve;
ESRI.ArcGIS.ADF.Web.Display.Graphics.ElementGraphicsLayer glayer = null;
DataTable pDT = new DataTable();
for (int i = 0; i < sLyrNames.Length; i++)
{
if (m_VCrsLyrname == string.Empty)
{
pDT = pQueryFun.Query(null, sLyrIDs[i], pQFilter);
if (pDT.Rows.Count > 0)
{
ESRI.ArcGIS.ADF.Web.DataSources.Graphics.MapFunctionality pMapFun1 = map.GetFunctionality("TempEle") as ESRI.ArcGIS.ADF.Web.DataSources.Graphics.MapFunctionality;
//if (pMapFun1 == null) return "";
ESRI.ArcGIS.ADF.Web.DataSources.Graphics.MapResource pGraRes = pMapFun1.Resource as ESRI.ArcGIS.ADF.Web.DataSources.Graphics.MapResource;
//if (pGraRes.Graphics == null) return "";
if (!pGraRes.Graphics.Tables.Contains(sLyrNames[i]))
{
glayer = new ESRI.ArcGIS.ADF.Web.Display.Graphics.ElementGraphicsLayer();
glayer.TableName = sLyrNames[i];
map.Page.Session["VCrossLyrName"] = sLyrNames[i];
m_VCrsLyrname = sLyrNames[i];
pGraRes.Graphics.Tables.Add(glayer);
}
else
{
map.Page.Session["VCrossLyrName"] = sLyrNames[i];
m_VCrsLyrname = sLyrNames[i];
glayer = pGraRes.Graphics.Tables[m_VCrsLyrname] as ESRI.ArcGIS.ADF.Web.Display.Graphics.ElementGraphicsLayer;
if (glayer.Rows.Count > 0)
glayer.Rows.Clear();
}
pGraRes.DisplaySettings.Transparency = 0;
ESRI.ArcGIS.ADF.Web.Display.Graphics.GraphicsLayer pGraLyr = ESRI.ArcGIS.ADF.Web.Converter.ToGraphicsLayer(pDT);
if (pRowLst == null)
{
pRowLst = new ArrayList();
map.Page.Session["VCrossLst"] = pRowLst;
}
for (int j = 0; j < pDT.Rows.Count; j++)
{
pRowLst.Add(pDT.Rows[j]);
ESRI.ArcGIS.ADF.Web.Geometry.Geometry pSelGeo = pGraLyr.GeometryFromRow(pDT.Rows[j]) as ESRI.ArcGIS.ADF.Web.Geometry.Geometry;
ESRI.ArcGIS.ADF.Web.Display.Graphics.GraphicElement pGraEle = new ESRI.ArcGIS.ADF.Web.Display.Graphics.GraphicElement(pSelGeo, System.Drawing.Color.Red);
glayer.Add(pGraEle);
}
pDT.Dispose();
if (map.ImageBlendingMode == ImageBlendingMode.WebTier)
map.Refresh();
else
map.RefreshResource("TempEle");
}
pDT.Dispose();
}
else if (m_VCrsLyrname == sLyrNames[i])
{
pDT = pQueryFun.Query(null, sLyrIDs[i], pQFilter);
if (pDT.Rows.Count > 0)
{
ESRI.ArcGIS.ADF.Web.DataSources.Graphics.MapFunctionality pMapFun1 = map.GetFunctionality("TempEle") as ESRI.ArcGIS.ADF.Web.DataSources.Graphics.MapFunctionality;
ESRI.ArcGIS.ADF.Web.DataSources.Graphics.MapResource pGraRes = pMapFun1.Resource as ESRI.ArcGIS.ADF.Web.DataSources.Graphics.MapResource;
// ESRI.ArcGIS.ADF.Web.Display.Graphics.ElementGraphicsLayer glayer = null;
if (!pGraRes.Graphics.Tables.Contains(sLyrNames[i]))
{
glayer = new ESRI.ArcGIS.ADF.Web.Display.Graphics.ElementGraphicsLayer();
glayer.TableName = sLyrNames[i];
map.Page.Session["VCrossLyrName"] = sLyrNames[i];
m_VCrsLyrname = sLyrNames[i];
pGraRes.Graphics.Tables.Add(glayer);
}
else
{
glayer = pGraRes.Graphics.Tables[m_VCrsLyrname] as ESRI.ArcGIS.ADF.Web.Display.Graphics.ElementGraphicsLayer;
}
pGraRes.DisplaySettings.Transparency = 0;
ESRI.ArcGIS.ADF.Web.Display.Graphics.GraphicsLayer pGraLyr = ESRI.ArcGIS.ADF.Web.Converter.ToGraphicsLayer(pDT);
for (int j = 0; j < pDT.Rows.Count; j++)
{
pRowLst.Add(pDT.Rows[j]);
ESRI.ArcGIS.ADF.Web.Geometry.Geometry pSelGeo = pGraLyr.GeometryFromRow(pDT.Rows[j]) as ESRI.ArcGIS.ADF.Web.Geometry.Geometry;
ESRI.ArcGIS.ADF.Web.Display.Graphics.GraphicElement pGraEle = new ESRI.ArcGIS.ADF.Web.Display.Graphics.GraphicElement(pSelGeo, System.Drawing.Color.Red);
glayer.Add(pGraEle);
}
if (map.ImageBlendingMode == ImageBlendingMode.WebTier)
map.Refresh();
else
map.RefreshResource("TempEle");
}
}
}
if (pRowLst.Count > 0)
{
ArrayList pLst =commCls.WriteData(glayer, pMapRes as ESRI.ArcGIS.ADF.Web.DataSources.ArcGISServer.MapResourceLocal, pRowLst);
if (pLst != null)
{
map.Page.Session["DMFX"] = pLst;
//sJS = "var win=window.open('VerAnaResult.aspx','','left=0,top=0,width=1024,height=650,toolbar=no,location=no,status=yes,menubar=no,scrollbars=no,resizable=no');win.focus();";
sJS = "var win=new ShowWindow('纵断面分析', 'VerAnaResult.aspx', 1024, 700,100,120,true);win.show();";
object[] oa1 = new object[1];
oa1[0] = sJS;
CallbackResult rst1 = new CallbackResult(map.Page, "javascript", oa1);
map.CallbackResults.Add(rst1);
return map.CallbackResults.ToString();
}
}
map.Page.Session.Remove("VCrossLyrName");
map.Page.Session.Remove("VCrossLst");
pDT.Dispose();
}
}
}
catch (Exception ex)
{
SystemLog.WriteLog("纵断面分析出错!", ex);
}
return "";
}
//在管段数据中必须得包括起点高程、起点埋深,终点高程,终点埋深。
public class commCls
{
//写纵断面数据
public static ArrayList WriteData(ESRI.ArcGIS.ADF.Web.Display.Graphics.ElementGraphicsLayer pGraLyr, ESRI.ArcGIS.ADF.Web.DataSources.ArcGISServer.MapResourceLocal pMapLocalRes, ArrayList pRowsLst)
{
try
{
if (pGraLyr == null) return null;
if (pGraLyr.Rows.Count < 1) return null;
IServerContext pSC = pMapLocalRes.ServerContextInfo.ServerContext;
using (ESRI.ArcGIS.ADF.ComReleaser pComRelease = new ESRI.ArcGIS.ADF.ComReleaser())
{
IMapServerObjects pMapOjbs = pMapLocalRes.MapServer as IMapServerObjects;
pComRelease.ManageLifetime(pMapOjbs);
IMap pMap = pMapOjbs.get_Map(pMapLocalRes.DataFrame);
pComRelease.ManageLifetime(pMap);
IFeatureLayer pFlyr = null;
for (int i = 0; i < pMap.LayerCount; i++)
if (pMap.get_Layer(i).Name == pGraLyr.TableName)
{
pFlyr = pMap.get_Layer(i) as IFeatureLayer;
pComRelease.ManageLifetime(pFlyr);
break;
}
if (pFlyr == null) return null;
DataTable pDTT = ESRI.ArcGIS.ADF.Web.Converter.ToDataTable(pGraLyr);
string s = pDTT.TableName;
// public string TypeName; //管线类型名称(大类)
//public string TypeCode; //管线类型代码(大类)
//public string SubTypeName; //管线类型名称(小类)
//public string subTypeCode; //管线类型代码(小类)
//public float SurfH1; //起点地面高程 ★
//public float SurfH2; //终点地面高程 ★
//public string Exp1; //起始点号
//public string Exp2; //终止点号
//public float Deep1; //起点埋深
//public float Deep2; //终点埋深
//public string Ds; //管径(取自字段值)
string sSaveStr ="\"浙江省天然气\",\"纵断面分析\",\"1234\"" + Environment.NewLine, sExp = "/";
ArrayList arFileData = new ArrayList();
arFileData.Add("\"浙江省天然气\",\"纵断面分析\",\"1234\"");
int FldExp1, FldExp2, FldEla1, FldEla2, FldD1, FldD2, FldDs,FldHD;
string Exp1, Exp2;
FldExp1 = (pRowsLst[0] as DataRow).Table.Columns.IndexOf("STARTPOINT");
FldExp2 = (pRowsLst[0] as DataRow).Table.Columns.IndexOf("ENDPOINT");
FldEla1 = (pRowsLst[0] as DataRow).Table.Columns.IndexOf("SELAVATION");
FldEla2=(pRowsLst[0] as DataRow).Table.Columns.IndexOf("EELAVATION");
FldD1 = (pRowsLst[0] as DataRow).Table.Columns.IndexOf("SDEPTH");
FldD2 = (pRowsLst[0] as DataRow).Table.Columns.IndexOf("EDEPTH");
FldDs = (pRowsLst[0] as DataRow).Table.Columns.IndexOf("PIPEDIAMETER");
FldHD = (pRowsLst[0] as DataRow).Table.Columns.IndexOf("HORIZONTALDISTANCE");
string SubName = pGraLyr.TableName;
string pipeColor = "0";
ESRI.ArcGIS.ADF.Web.Geometry.Geometry pAdfGeo = null;
ESRI.ArcGIS.ADF.Web.Geometry.Point pPnt = null;
ESRI.ArcGIS.ADF.Web.Geometry.Point pPnt1 = null;
string FtrString = String.Empty;
double H = 0, H1=0,Deep1, Deep2, H2 = 0;
for (int iR = 0; iR < pGraLyr.Rows.Count; iR++)
{
string sPrjNo = string.Empty, sEPrjNo = string.Empty;
pAdfGeo = pGraLyr.GeometryFromRow(pGraLyr.Rows[iR]);
pPnt = (pAdfGeo as ESRI.ArcGIS.ADF.Web.Geometry.Polyline).Paths[0].Points[0];
int n1 = (pAdfGeo as ESRI.ArcGIS.ADF.Web.Geometry.Polyline).Paths.Count;
int n2 = (pAdfGeo as ESRI.ArcGIS.ADF.Web.Geometry.Polyline).Paths[n1-1].Points.Count;
Deep1 = Math.Round(Convert.ToDouble((pRowsLst[iR] as DataRow)[FldD1]), 2);
Deep2 = Math.Round(Convert.ToDouble((pRowsLst[iR] as DataRow)[FldD2]), 2);
H1 = Math.Round(Convert.ToDouble((pRowsLst[iR] as DataRow)[FldEla1]), 2);
H2 = Math.Round(Convert.ToDouble((pRowsLst[iR] as DataRow)[FldEla2]), 2);
//获得管段起始点和终止点的高程
FtrString = pPnt.X.ToString() + "," + pPnt.Y.ToString() + "," + pipeColor + "," + (H1 + Deep1).ToString() + "," + H1.ToString() + "," + (pRowsLst[iR] as DataRow)[FldDs].ToString();
arFileData.Add(FtrString);
pPnt1 = (pAdfGeo as ESRI.ArcGIS.ADF.Web.Geometry.Polyline).Paths[n1-1].Points[n2-1];
FtrString = pPnt1.X.ToString() + "," + pPnt1.Y.ToString() + "," + pipeColor + "," + (H2 + Deep2).ToString() + "," + H2.ToString() + "," + (pRowsLst[iR] as DataRow)[FldDs].ToString();
arFileData.Add(FtrString);
}
return arFileData;
}
}
catch (Exception Err)
{
string s = Err.Message;
return null;
}
}
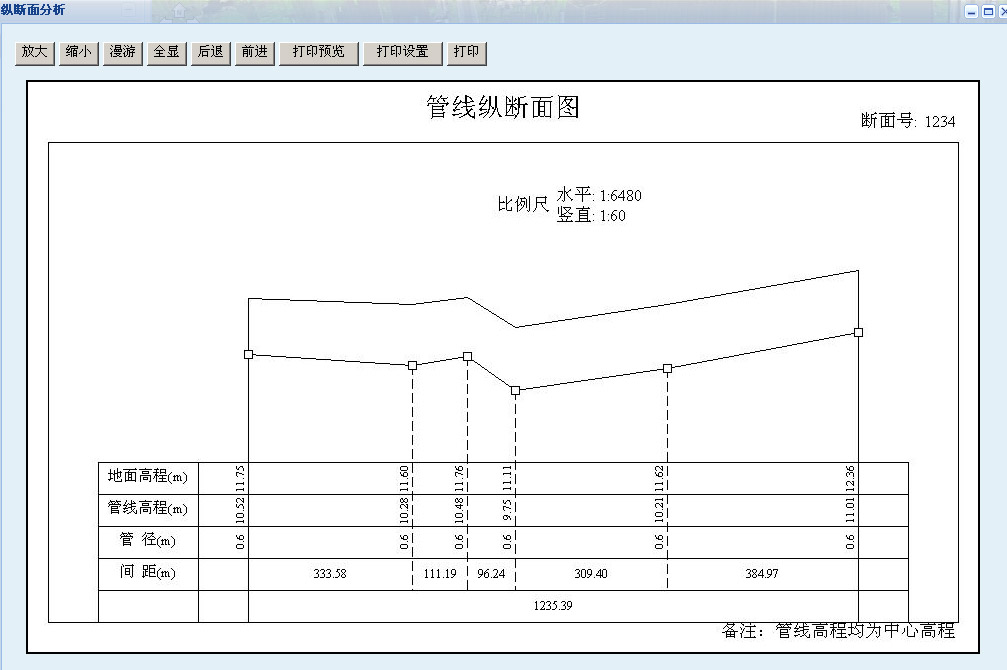
接着就是自己将结果 arFileData展示出来了。