Source Monitor is a code analyzing tool that is capable of finding the complexity for Java, C++、C、C#、Delphi、Visual Basic and HTML source codes. It's a standalone software which does not rely upon any specific IDE to work. What's even better is that it is a Free Software. In this tutorial I'll show you how to install and use this convenient tool analyze some code.
1. Download Source Monitor from http://www.campwoodsw.com/sourcemonitor.html. Run the setup wizard.

2. Click "Next" to install. Choose the installaion path, etc. Nothing unusual.
3. Open the installed software. In the welcome screen, click "Start SourceMonitor" to begin.
4. Before proceeding to analyze some code. Let's open the settings page and tick "allow parsing of UTF-8 files" as some of the source code files may be stored in UTF-8 format.

5. Click "New..." to begin analyze the code. In Step1, we select the language of the code. Here "Java" is chosen as we're going to analyze a Java project.

6. In Source Monitor, each analysis is seen as a "Project". In this step, we choose where to save the data files of this analysis.

7. In Step 3, select the path of your source files.

8. In Step 4, specify some options for this analysis. Here we choose to ignore any blank lines in the source code.

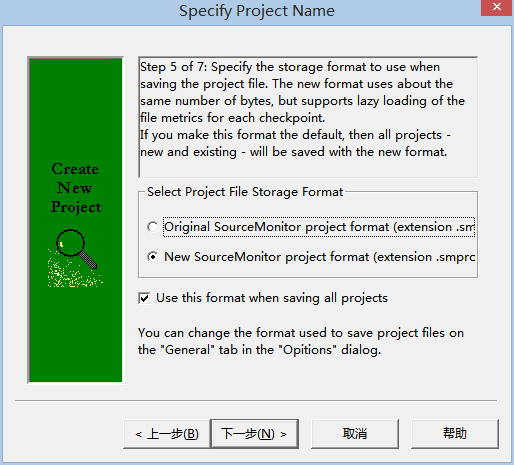
9. In the following step, choose the desired format to save the analysis project file.
10. Name the Project Checkpoint. Here we keep the default name, which is "Baseline".

11. In the final step, review a summary of the project settings. If it's OK, click "Finish" to start the actual analysis process.

12. Then it will ask you to choose which files to analyze. By default, it will automatically pick out all the files whose extension matches the language that we've selected in Step 1. In this tutorial, as we've selected "Java" in the first step, all .java files are selected automatically. Click "OK" to proceed.

13. A moment later, the job will finish and shows a general report the whole project.

14. Double click it will bring you to a new screen where the detailed reports of each file are shown.

This brings the tutorial to an end. If you're interested in more information about Source Monitor, you can visit its official website http://www.campwoodsw.com/sourcemonitor.html
Your feedbacks and suggestions are greatly appreciated.